
What it includes
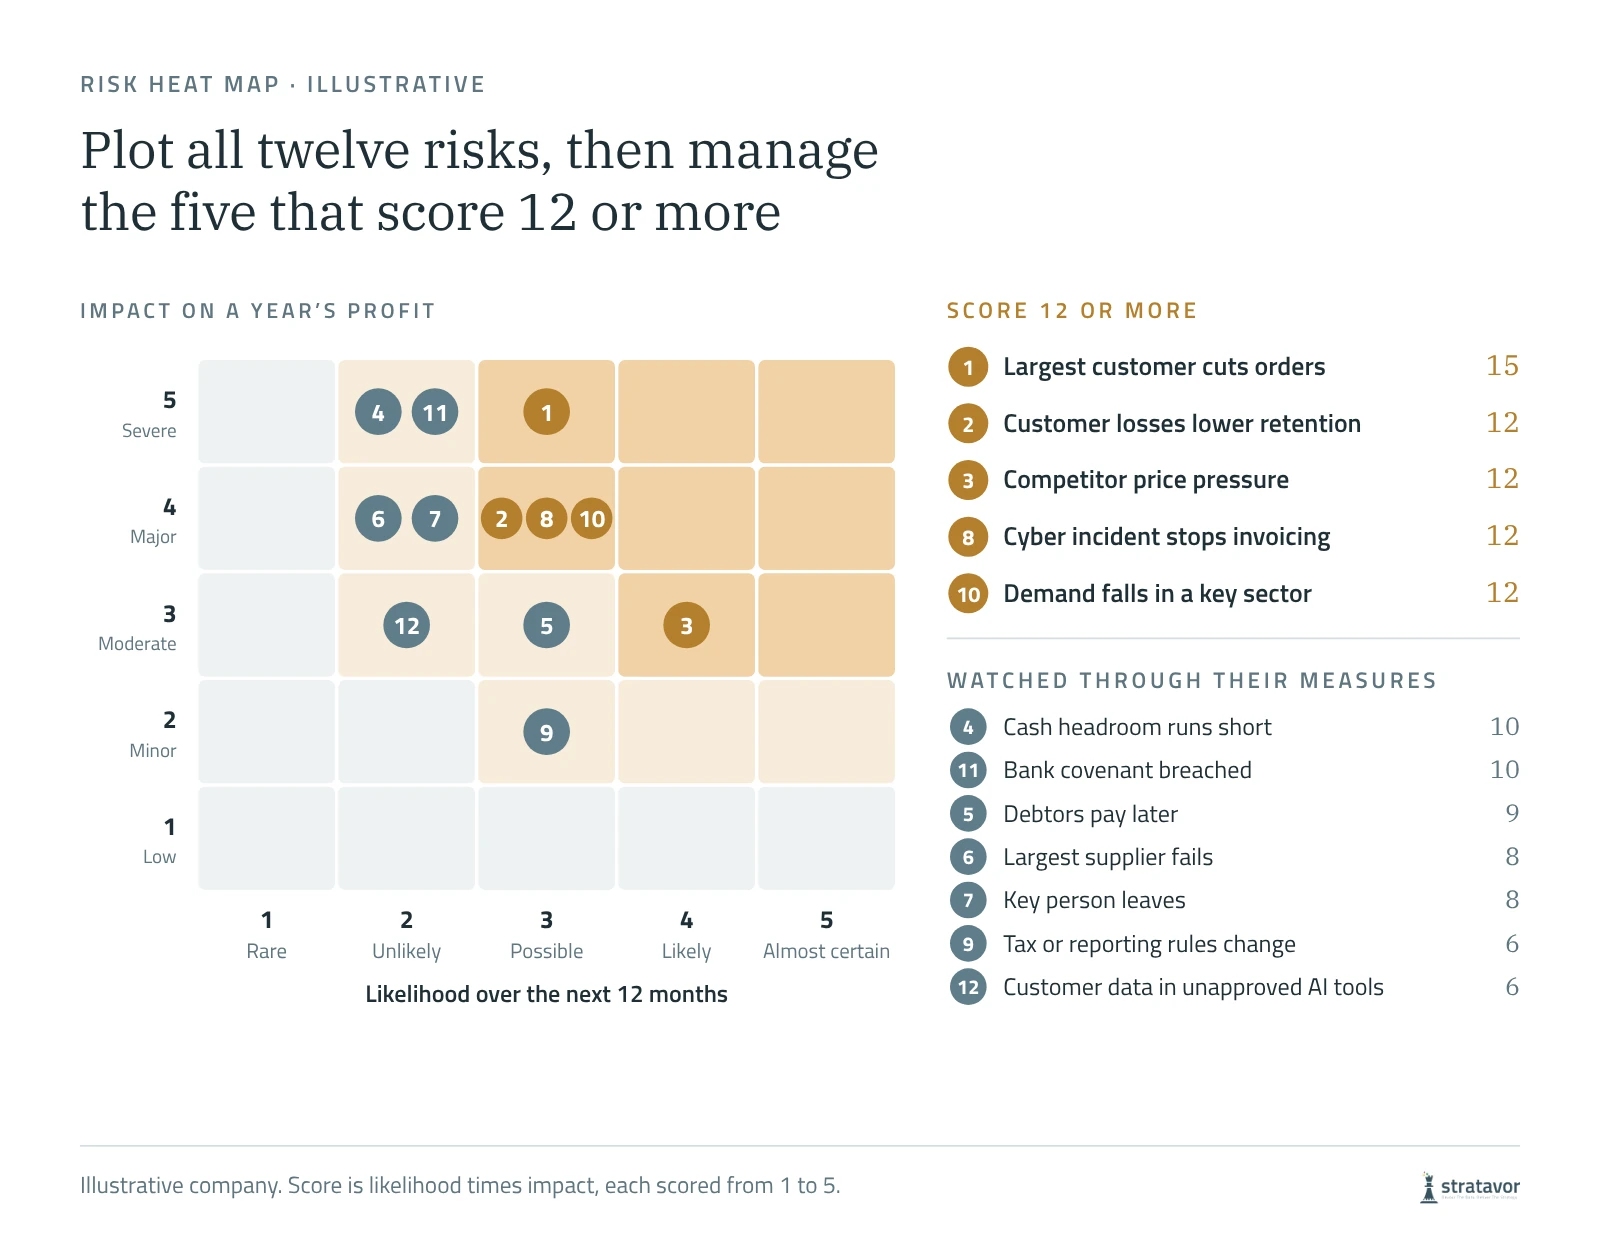
A register with nine columns and twelve illustrative risks, money bands for impact, a heat map that counts the risks in each cell and a top five ranked by score. Every score and count is a formula.
Template
A one-page risk register for a business without a risk manager. Score each risk for likelihood and impact, tie it to a measure with a threshold, and the heat map and top five update as you go.
A register with nine columns and twelve illustrative risks, money bands for impact, a heat map that counts the risks in each cell and a top five ranked by score. Every score and count is a formula.
Owners, managing directors and finance leads of businesses with roughly €1m to €50m revenue who need a live register for the board, a lender or an investor, without a risk function.
Replace the examples with your own risks and set the impact bands for your size. Review it for 30 minutes each month with the management accounts, and take the top five to the board each quarter.
The heat map tab counts your risks by likelihood and impact as you score them. The ones that score 12 or more get a named action and a date every month; the rest are watched through their measures.
Many of the best measures are already in the monthly accounts: customer concentration, debtor days, cash headroom and margin by line. Stratavor connects read-only to Xero, QuickBooks Online, Sage, NetSuite, Deltek Vantagepoint and HubSpot and computes them in code from the ledger, so the measures in your register come from the same numbers as your management accounts. The Power BI add-on carries the same figures into Power BI.
Microsoft and Power BI are trademarks of the Microsoft group of companies.