
Board packs and management reporting for Deltek Vantagepoint firms
Jon Goodwin ·
Estimated reading time: 8 min
The short answer. Build the pack around five numbers: net revenue, utilisation, the net multiplier, the overhead rate and operating margin on net revenue, with backlog and lock-up alongside. Margin is the gap between the net multiplier and the break-even multiplier, which is one plus the overhead rate, so every movement in profit traces back to one of those levers. Vantagepoint holds the data and flags problems project by project. The board pack turns those signals into the firm-level picture, names what moved it, and sets out what the partners need to decide.
Architecture, engineering and consulting firms run on different numbers from most businesses. Fees are earned through people's time, profit depends on how much of that time is billable and at what multiplier, and cash depends on how fast work in progress becomes an invoice and an invoice becomes cash. Deltek Vantagepoint, the ERP Deltek built for these firms, holds all of it. This guide sets out what a board pack built from Vantagepoint should contain, the arithmetic that ties the KPIs to profit, and how to write commentary a board can act on.
The KPIs that belong in the pack
Most of these already live in Vantagepoint. The pack's job is to show them together, every month, against budget and last year, so the board can see which lever moved.
| KPI | How it is calculated | What the board reads from it |
|---|---|---|
| Net revenue | Fees less reimbursable expenses and consultants' fees | What the firm earns from its own people; the base for every ratio below |
| Utilisation | Chargeable hours, or chargeable salary cost, as a share of the total | How much of the time the firm pays for is earning fees |
| Net multiplier | Net revenue divided by direct labour cost | What each pound of billable salary earns |
| Overhead rate | Indirect costs, including non-chargeable salaries, divided by direct labour cost | What it costs to support each pound of billable salary |
| Operating margin | Operating profit as a share of net revenue | Whether pricing and staffing sit clear of break-even |
| Backlog | Contracted fees not yet earned, in pounds and in months of net revenue | How secure the next two quarters are |
| Lock-up | Work in progress days plus debtor days | How long it takes to turn work into cash |
| Project margin and write-offs | Fees earned against cost to date, by project, manager and office | Where margin is leaking before it reaches the P&L |
Keep the definitions fixed from month to month and print them on the KPI page. A multiplier calculated on total labour one month and on direct labour the next will move by itself, and the board will ask why. For the wider set of professional services measures, including realisation, see the nine numbers that matter for professional services firms.
Margin is the gap between two multipliers
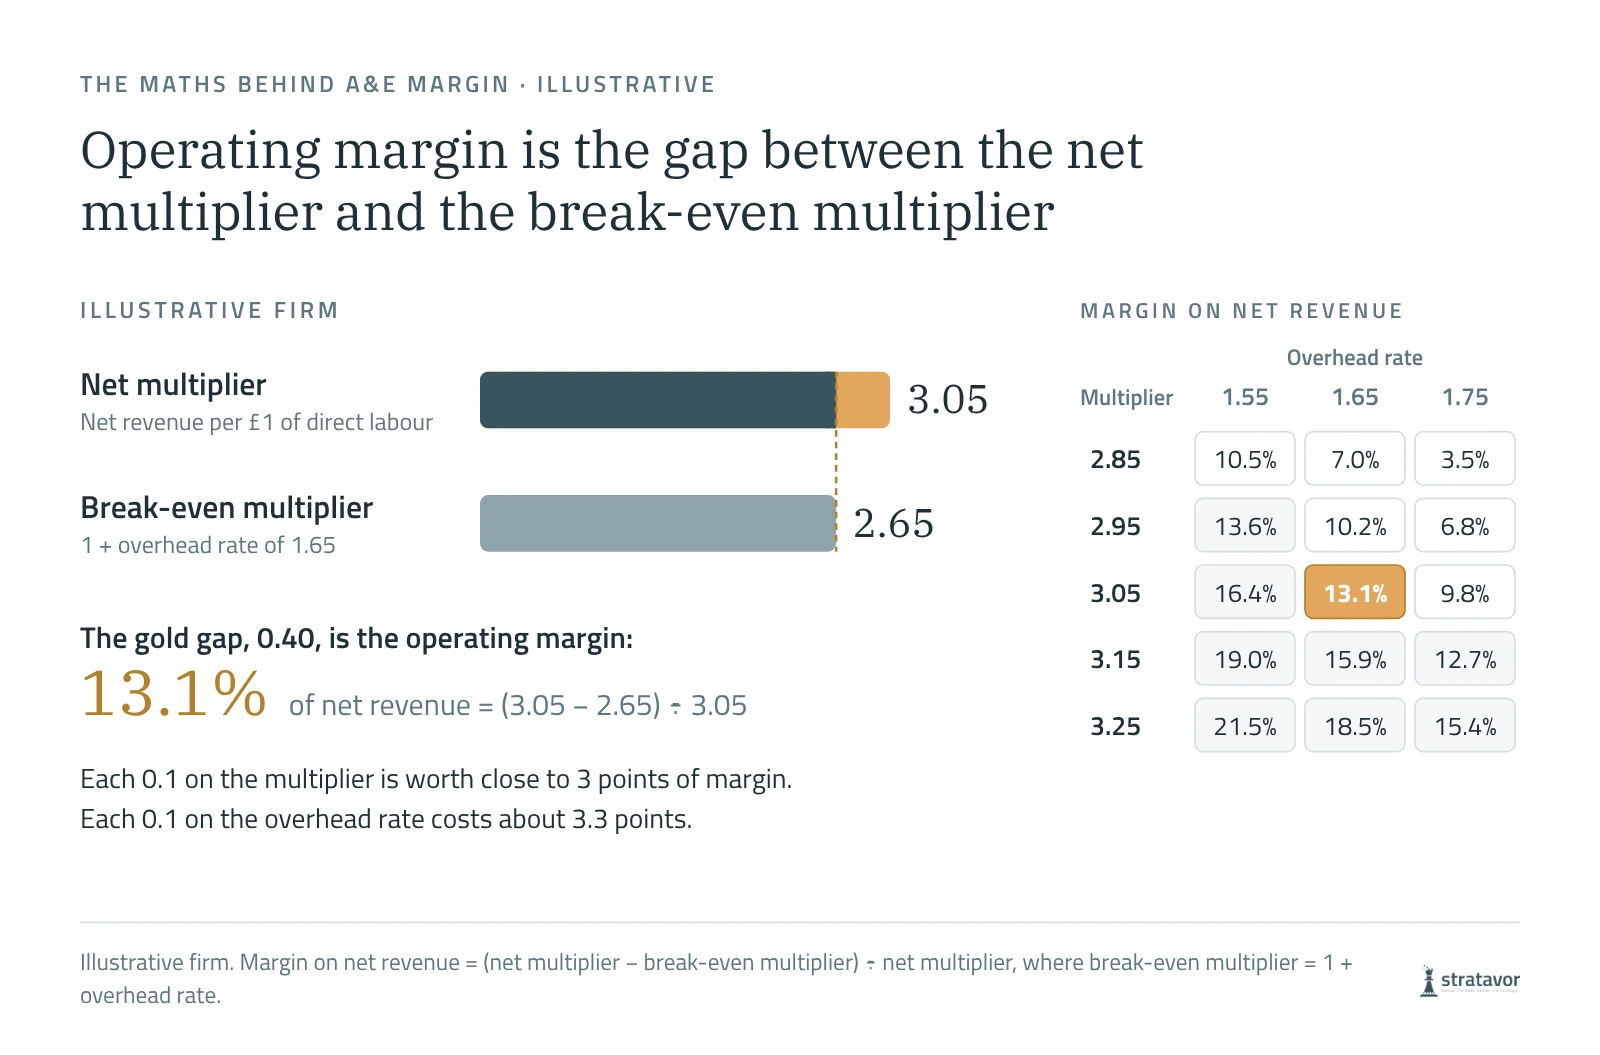
The arithmetic that links these ratios is short, and worth putting in front of every partner. Operating profit is net revenue less direct labour less overhead. Divide each term by direct labour and profit becomes the net multiplier, less one, less the overhead rate. The break-even multiplier is one plus the overhead rate: the multiplier at which the firm covers its costs and makes nothing. Margin on net revenue is the gap between the two multipliers, divided by the net multiplier.
In the illustrative firm, a net multiplier of 3.05 against an overhead rate of 1.65 gives a break-even multiplier of 2.65 and a margin of 13.1%. The grid shows why boards should watch the overhead rate as closely as pricing. A rise of 0.1 in the overhead rate costs 3.3 points of margin, slightly more than a fall of 0.1 in the multiplier, and overhead creeps up through decisions that never reach the board one at a time: an extra coordinator, a larger office, a bid team carried through a quiet quarter.
For context, the 2026 Deltek Clarity A&E study, in its 47th year, put operating profit at 16.7% of net revenue and utilisation just under 60%, both down on the year before, across 896 firms in the US and Canada. UK and Irish firms should treat those as reference points rather than targets, but it is worth knowing where the firm sits against them.
Utilisation, in pounds
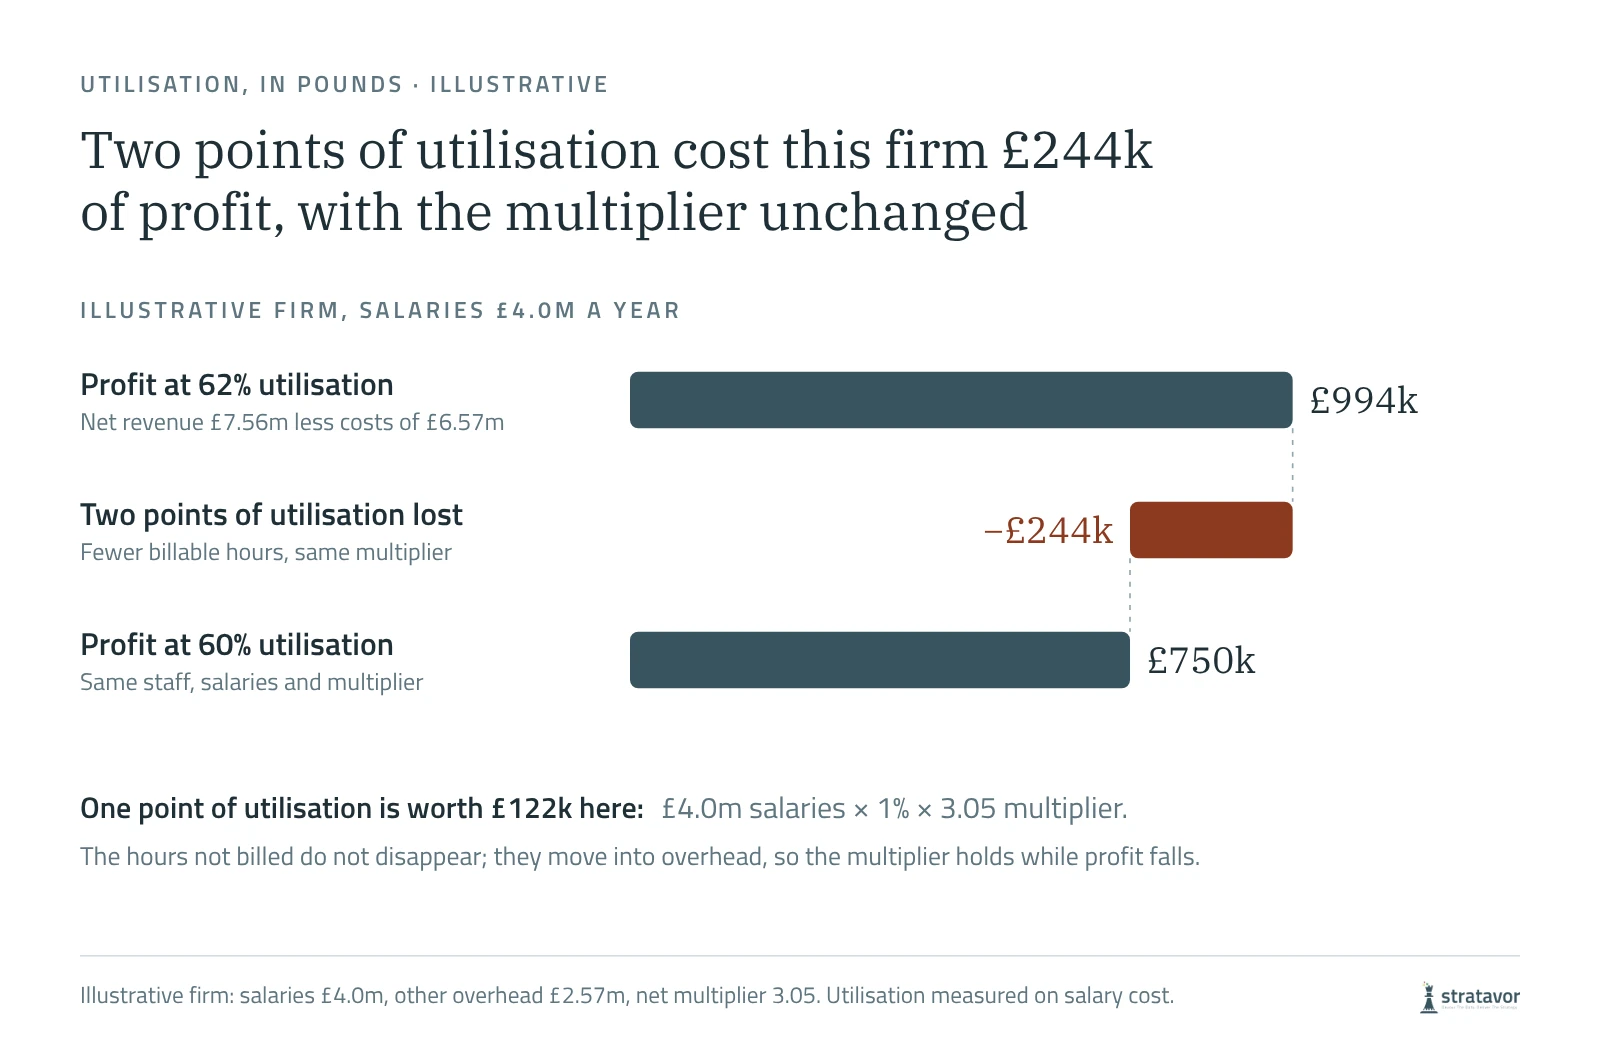
Utilisation is usually reported as a percentage, which hides what it is worth. Convert it into pounds and it becomes one of the most important lines in the pack. In the illustrative firm, with £4.0m of salaries and a net multiplier of 3.05, each point of utilisation is worth £122,000 a year: £4.0m, times 1%, times 3.05. Two points lost cost £244,000 of profit, a quarter of the year's operating profit.
The multiplier does not move at all. The hours that were not billed do not disappear: they are still paid for, so their cost moves from direct labour into overhead, the overhead rate rises from 1.65 to about 1.74, and the break-even multiplier rises with it. A pack that reports the multiplier without utilisation can look healthy while profit falls. Report the two together, and report utilisation by team and office, because a firm average hides where the hours went.
What Vantagepoint gives you
Vantagepoint is built for these firms and does much of the monitoring well. Deltek describes interactive dashboards for financial health, project dashboards for project managers, and resource views showing who is over or under used. Its native AI, Dela, has been in production since 2023. Deltek says it alerts finance teams to GL trends and billing gaps early, surfaces a GL account trending outside its normal range before close, and flags projects that are earning faster than they bill or building up cost faster than they report progress. Firms that report in Power BI connect Vantagepoint through third-party connectors and consultancies.
Those signals are aimed at the people who run projects and the finance team, one project or one account at a time. The board pack is a different job. A board needs the firm-level view: which of the five levers moved this month, by how much, which teams, offices or projects drove it, and what the partners should decide. Turning hundreds of project signals into six paragraphs a board can act on is the work that still takes days each month.
Writing the commentary
Each material movement gets four sentences: what happened, why, what it changes and what to do. Here is the illustrative firm's September, written that way.
Illustrative. September operating profit was £62,500, £20,300 below budget, with the net multiplier on budget at 3.05. The whole shortfall is utilisation, which fell from 62% to 60%, almost all of it in the structures team, where two senior engineers spent three weeks on an unbilled bid. If utilisation stays at 60% for a full year, that is £244,000 of profit. The board is asked whether to cap unbilled bid time at a set share of each team's hours, or to accept the lower margin until the bid pipeline converts.
The version most packs carry reads: profit was below budget due to lower utilisation. It is accurate, and it gives the board nothing to decide. The difference is the cut: by team, by office, by project, until one cause explains most of the movement. Our board commentary template sets out the four-sentence standard, and our guide to management accounts with commentary shows the same method on a different kind of business.
Where Stratavor fits
Stratavor connects directly to Deltek Vantagepoint, as well as Xero, QuickBooks Online, Sage and NetSuite, with HubSpot for pipeline context. It computes every figure from the ledger in code, then writes commentary on each material movement that names its cause and frames the question for the board, so the pack arrives as a draft to review rather than a blank page. It reports on single firms and across groups, which matters for practices that run several offices or entities, and the Power BI add-on puts the same figures and commentary into Power BI for firms that already report there.
Stratavor is not a forecasting tool. Resource plans, fee projections and project forecasts stay in Vantagepoint; Stratavor reports and explains what the ledger shows. See the integrations or talk to us about a Vantagepoint pack.
Sources
Checked on 7 November 2026.
- Deltek: key takeaways from the 2026 Clarity A&E study, 26 May 2026
- Deltek: the latest Clarity industry studies, press release, 12 May 2026
- Deltek: Vantagepoint business intelligence and reporting
- Deltek: Dela in Vantagepoint
- Deltek: Dela in Vantagepoint, from reactive to proactive, 7 October 2026
- Wiss: Power BI for Deltek Vantagepoint
Microsoft and Power BI are trademarks of the Microsoft group of companies.
Frequently asked questions
What should a board pack for an architecture or engineering firm include?
Net revenue, utilisation, the net multiplier, the overhead rate and operating margin on net revenue, each against budget and last year, with backlog, lock-up and project margin alongside. Then commentary on each material movement that names the cause, and the decisions the board is asked to make.
What is a good net multiplier?
There is no single good figure; what matters is the gap to the break-even multiplier, which is one plus the overhead rate. A firm with an overhead rate of 1.65 breaks even at a multiplier of 2.65. At 3.05 it makes 13.1% of net revenue; at 2.85 it makes 7.0%.
How is utilisation calculated, and why does it matter to the board?
Utilisation is chargeable hours as a share of total hours, or chargeable salary cost as a share of total salary cost. Each point is worth roughly total salaries times 1% times the net multiplier over a year: £122,000 for a firm with £4.0m of salaries and a multiplier of 3.05.
Can Deltek Vantagepoint produce a board pack?
Vantagepoint holds the data a board pack needs, with dashboards, reports and alerts from its AI, Dela, on GL trends, billing gaps and projects whose costs are running ahead of progress. Firms that report in Power BI connect it through third-party connectors. The firm-level commentary, what moved, why and what to decide, is still written by people, or drafted by a tool such as Stratavor that connects to Vantagepoint.
What did the 2026 Deltek Clarity A&E study find?
Published in May 2026 from a survey of 896 architecture and engineering firms in the US and Canada, it found operating profit at 16.7% of net revenue, utilisation just under 60%, a forecast of 9.5% growth in net revenue for 2026 and staff turnover of 13.8%. 78% of firms used generative AI, up from 64% a year earlier.
Does Stratavor work with Deltek Vantagepoint?
Yes. Stratavor connects directly to Deltek Vantagepoint, computes every figure from the ledger in code and writes the commentary for the board pack, for single firms and across groups. It also connects to Xero, QuickBooks Online, Sage, NetSuite and HubSpot.