
What it includes
Thirteen pages: the short answer, the eight steps each on a page of its own with a worked example, the formula and the decision it leads to, a variance page rebuilt for a board pack, and the ten formulas on one page.
Tools and templatesFramework
What changed, why it matters and what to do about it. Eight steps from budget against actual to a decision the board can take, worked through one month at an illustrative company, with ten formulas.
Thirteen pages: the short answer, the eight steps each on a page of its own with a worked example, the formula and the decision it leads to, a variance page rebuilt for a board pack, and the ten formulas on one page.
Finance directors, financial controllers and FP&A leads of businesses with roughly €1m to €50m revenue, and the advisers and fractional finance directors who prepare their packs.
Agree the threshold with the board first, then work the steps in order each month on a ledger export and a budget by line. Every figure on the variance page should add up to the one above it.
Explain only the lines over a threshold agreed in advance. Flex the budget to the units sold before judging costs. Split each gap into price, volume, mix, rate and usage, in euro, so every figure has an owner. Then sort each cause by whether it reverses, repeats or will not happen again, say what the lasting ones do to the forecast, and finish with the decision.
A threshold agreed before the month, so the pack explains the lines that matter and no others.
Larger of €10k or 5% of the line's budget, plus every one-off: four of twelve lines.
Redraw the budget for the units actually sold, so lower costs from lower sales are not read as savings.
Cost of sales €55.8k under budget; €54.7k of it was selling less, €1.1k a real saving.
Line by line, in euro, so each figure has an owner.
Revenue €78.0k short: volume −€96.0k, price +€18.0k.
Three figures that add up to the change in gross margin.
38.0% to 38.4%: price +€11.2k, mix −€4.9k, cost +€1.1k.
More of something, or a higher price for it: different fixes.
Payroll −€18.3k, all usage: two contractors kept on past September.
Only the lasting causes change the year, so they get the board's time.
€33.6k comes back in November; €11.5k a month stays.
The next quarter as things stand, and with the actions the page asks for.
The quarter lands on budget only because a slipped order returns; €34.5k short underneath.
Four sentences, each with a figure: what happened, why, what it means, what to decide.
Release the contractors at 30 November and hire two engineers for January: +€38.8k on the quarter.
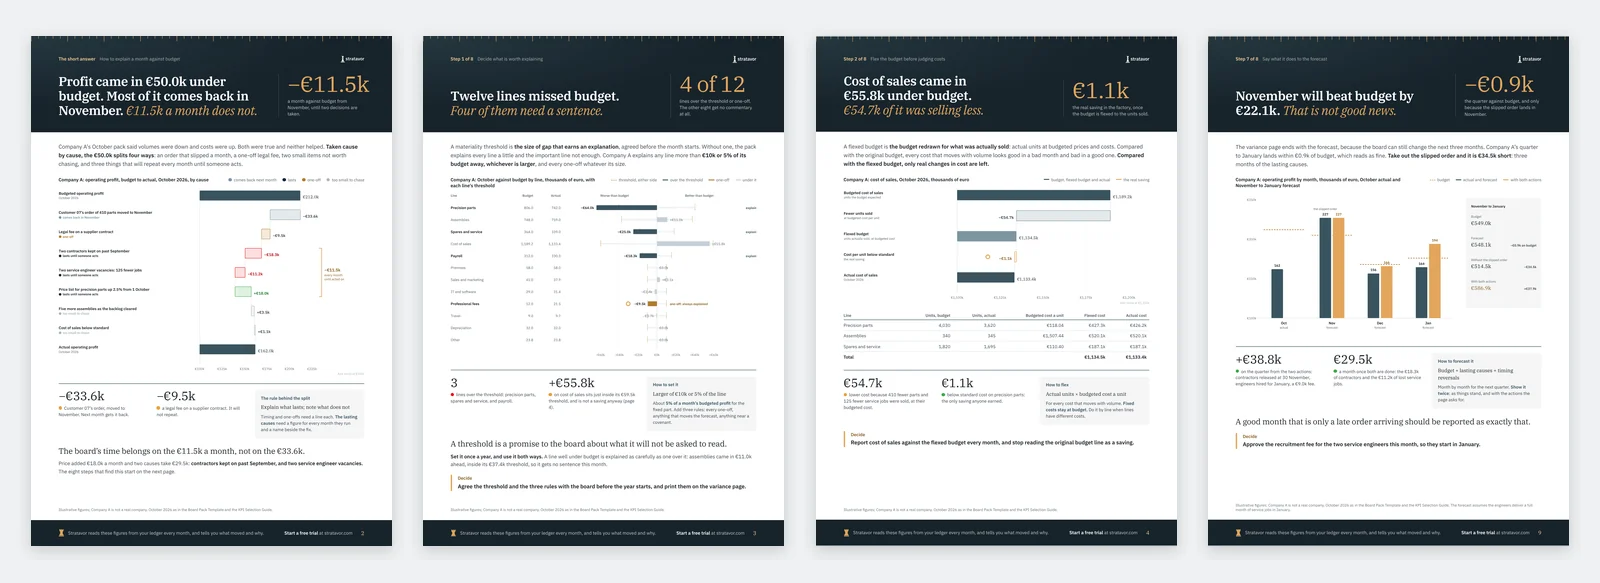
Worked in this order, every figure adds up to the one above it: lines to revenue, revenue and margin to gross profit, gross profit and overheads to operating profit. Positive is better than budget and negative is worse, for revenue and costs alike.
Every step in the framework is arithmetic on a ledger and a budget. Stratavor is the strategic intelligence platform that does that arithmetic every month, for the people who run the business.
Your ledger and CRM
Read-only connections to Xero, QuickBooks Online, Sage, NetSuite, Deltek Vantagepoint and HubSpot. Nothing is typed in.
Every movement against budget and last year is computed in code from the ledger and traced to the customer, line or account behind it.
Each report opens with the answer and ends with what to decide, against the levels your board has set.
The page your board reads
7-day free trial. No credit card required.
Why did profit miss budget, and will it happen again?
To decide
Release the two contractors at 30 November and approve the recruitment fee for two service engineers to start in January: €38.8k on the quarter.
The variance page the framework builds for Company A. Illustrative figures. Company A is not a real company.
The same rules across the whole pack: twelve paragraphs, each with a figure and a decision.
The pack Company A's figures come from, with the profit bridge this guide explains line by line.
Which measures belong in a board pack, and the levels to set before the year starts.
Variance analysis compares what happened with what was planned, usually actual results against budget, and explains the difference: how much of it came from price, volume, mix, cost rates or usage, whether it will reverse, repeat or not happen again, and what the board should do about it. Done well, it ends with a decision, not a list of differences.
Volume variance is the change in units at the budgeted price: (actual units − budgeted units) × budgeted price. Price variance is the change in price on the units actually sold: (actual price − budgeted price) × actual units. Worked line by line, the two add up to the revenue gap exactly. In the guide's example, 410 fewer precision parts at a budgeted €200 is −€82.0k of volume, and a 2.5% price rise on 3,620 parts is +€18.0k of price.
A flexed budget is the budget redrawn for the units actually sold: actual units at budgeted prices and costs. Against the original budget, every cost that moves with volume looks good in a bad month and bad in a good one. Against the flexed budget, only real changes in cost are left. In the guide, cost of sales came in €55.8k under budget, and €54.7k of that was simply selling less.
A common rule is the larger of a fixed amount and a percentage of the line's budget, for example €10k or 5%, set at about 5% of a month's budgeted profit. Add three rules: explain every one-off whatever its size, anything that changes the forecast and anything close to a banking covenant. Agree the threshold with the board before the year starts.
A timing variance reverses: the sale or cost lands in another month, such as an order delivered in November instead of October. A one-off will not repeat. A lasting variance repeats every month until someone acts, such as an unfilled role or a price change. Only the lasting ones change the year, so they belong at the top of the variance note, with a figure for each month they run.
In four sentences, each with a figure: what happened, why, what it means for the forecast, and what the board is asked to decide. Give the cause in euro, split into price, volume, mix, rate and usage, and say whether it will reverse, repeat or not happen again. "Volumes were down" describes; "one order of 410 parts moved to November" explains. In the guide's example, most of a €50.0k miss comes back the next month, and the board's time belongs on the €11.5k a month that does not.
Comment only on the lines over a threshold agreed in advance, such as the larger of €10k or 5% of the line's budget, plus every one-off. Flex the budget to the units sold before commenting on costs. For each line give the figure, the cause in euro, whether it lasts and what will be done: "Payroll €18.3k over: two contractors kept on past September, to be released at 30 November when the backlog clears" says more than "payroll was over budget due to staffing". If a sentence has no figure, it is not finished.
No. The guide explains how to do variance analysis by hand. Stratavor is a strategic intelligence platform: it connects read-only to your accounting system and CRM, computes the movements in code from the ledger, traces each one to the customer, line or account behind it, and writes what changed, why it matters and what to decide. Every new account starts with a 7-day free trial.
Yes. Download the PDF and use it as you like; there is no sign-up.