How to produce a board pack from QuickBooks Online
On this page
The short answer. QuickBooks Online builds a management report on every plan: a cover page, a contents page, text pages, financial reports and end notes, exported as a PDF. Advanced adds chart widgets, KPI scorecards, an AI-generated executive summary, scheduled delivery and new custom reports. Plus and Advanced add class tracking, which is what lets you explain a variance rather than describe it. Tag income and costs by class and location, budget by the same tags, run one fixed report each month, and write four sentences on every material variance: what happened, why, what it changes and what to do. Stratavor connects directly to QuickBooks Online, reads your classes and locations, and drafts that commentary from figures computed in code.
QuickBooks Online is where a lot of growing businesses keep their books, and its reporting has improved steadily. A management report can now carry the statements, a commentary page and, on Advanced, charts and an AI summary. What it cannot do on its own is tell the board why the month went the way it did. This guide covers what each plan gives you, a monthly routine, the tools that sit on top of QuickBooks, and how to write the part the board actually reads.
What QuickBooks gives you, plan by plan
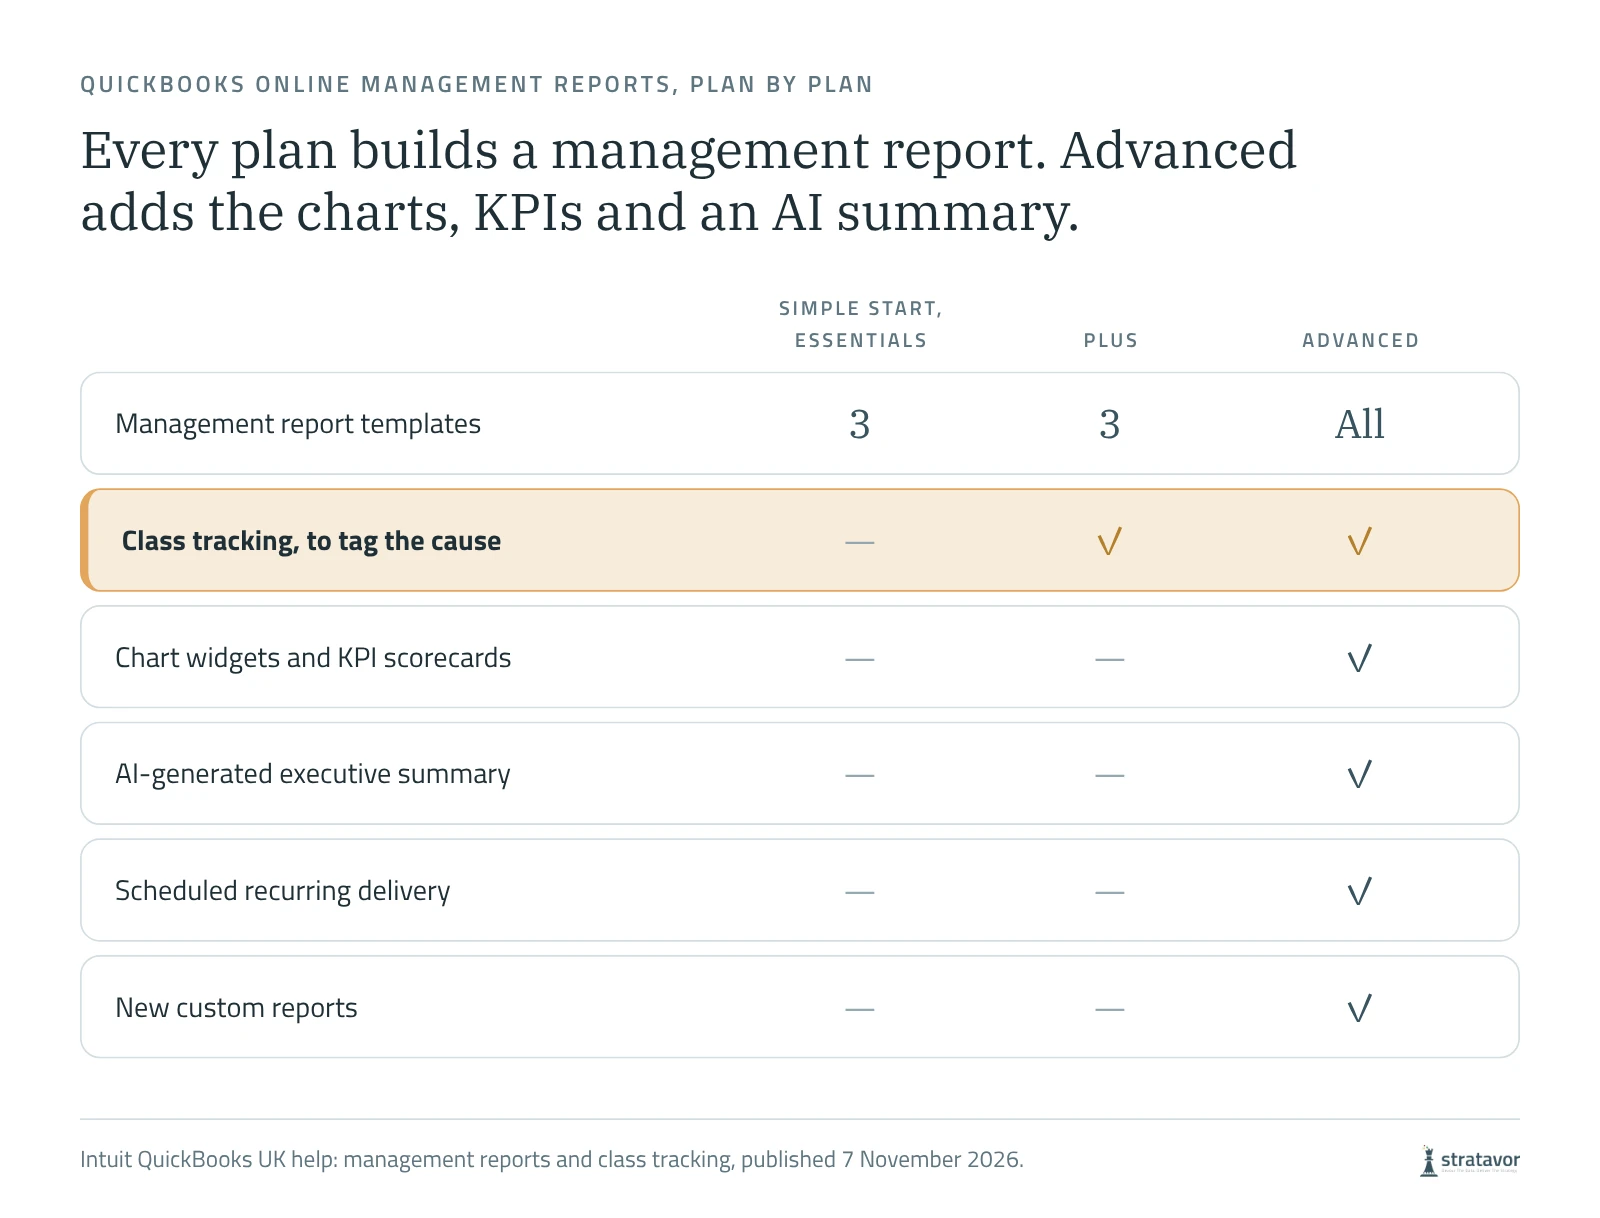
Intuit's help describes management reports as branded, presentation-ready reports that combine financial reports, key metrics and charts. Every report has a cover page with a logo, title, period and preparer, an optional contents page, editable preliminary pages, the financial reports themselves, and end notes that can break out sub-accounts. They export as PDF and can be emailed.
The plans differ in what goes inside. Simple Start, Essentials and Plus get three templates (company overview, sales performance and expenses performance), limited to financial tables and text boxes, with manual export. Advanced gets every template, including monthly, quarterly and annual comparisons, plus chart widgets, KPI scorecards, AI-generated executive summaries, automated recurring delivery and the ability to create new custom reports. Class tracking, which tags income and costs by business line, is available on Plus and Advanced.
Two practical points. Custom templates cannot be shared or copied between users in the same company file, so whoever owns the pack should own the template. And Intuit describes a legacy and a new interface with different features, so check which one your team is on before building.
A monthly routine for the pack
- Close the month. Reconcile the bank, clear the uncategorised transactions and lock the period before anything is reported.
- Tag by class and location. Agree how income and costs are tagged before the first pack, and budget by the same classes. Without them, no report can tell you what caused a variance.
- Run one fixed report. Build the management report once, with the profit and loss against budget and last year, the balance sheet and the KPIs, and run the same report every month.
- Set a materiality threshold. Comment on every variance above a set amount or percentage, and say nothing about the rest.
- Cut every material variance by class. Then by location, customer or product, until one cause explains most of it.
- Write four sentences per variance. What happened, why, what it changes and what to do. Our board commentary template sets out the standard.
- Put the decisions on page one. Use a preliminary page for the summary and the decisions the board is asked to make, before any statement.
For the KPIs themselves, our guide to board packs for Irish SMEs sets out eight that suit most businesses, with the formula for each.
A summary is not commentary
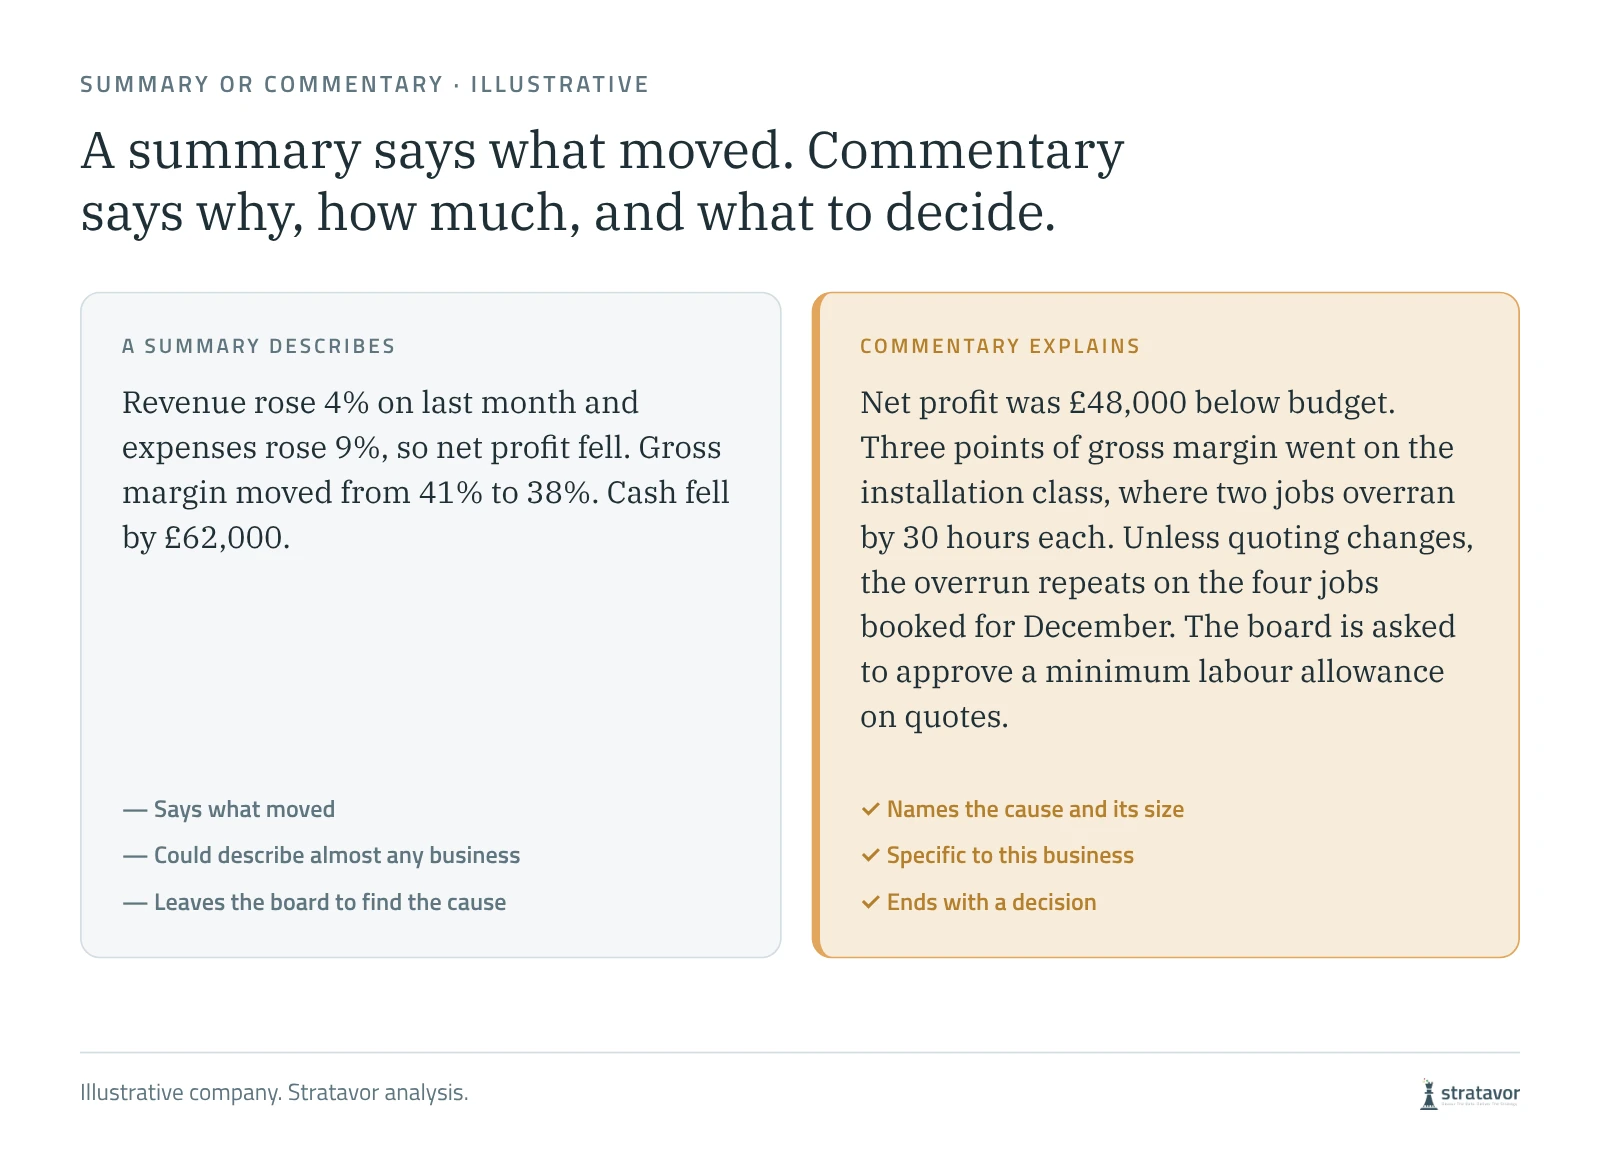
The AI-generated executive summary on Advanced is a real time saver for the first draft of a summary page. A summary, though, describes what moved. The board needs to know why, by how much, and what to decide, and that depends on the classes in the ledger and someone cutting each variance down to its cause.
In the illustrative company, the summary reports that margin fell from 41% to 38%. The commentary finds the three points in one class, names the two jobs that overran, says what it means for the jobs already booked, and asks the board for a decision. Only the second gives the board something to do.
Tools that sit on QuickBooks Online
| Tool | What it adds to QuickBooks reporting | Price signal, November 2026 |
|---|---|---|
| QuickBooks management reports | Cover, contents, text pages, statements and end notes; charts, KPI scorecards and an AI summary on Advanced | Included in the plan |
| Fathom | Management reports, KPIs, three-way forecasts, consolidation and Commentary Writer | Pro US$450 a month for 25 companies |
| Spotlight Reporting | Reporting, forecasting and dashboards, with an AI executive summary | UK adviser plans from £295 a month for up to 10 organisations |
| Syft | Reports, consolidation, budgets and forecasts | Published plans; a free version is listed |
| Joiin | Consolidation and reporting across entities | Scales with the number of entities |
| Stratavor | Commentary on every material movement, naming the cause and framing the board's question, from figures computed in code | From €499 a month |
A reporting app suits a business that wants richer formatting and a three-way forecast than QuickBooks provides. Joiin suits a group with several QuickBooks files to consolidate. If the numbers are ready but the commentary still takes days, the gap is the analysis. Our guide to Xero reporting tools compares the reporting apps in more depth, and most of them work with QuickBooks too. Our guide to management reporting software for UK SMEs compares eight tools across Xero, QuickBooks and Sage.
Where Stratavor fits
Stratavor connects directly to QuickBooks Online, as well as Xero, Sage, NetSuite and Deltek Vantagepoint, with HubSpot for customer and pipeline context. It reads your classes and locations, computes every figure from the ledger in code, and writes commentary on each material movement that names its cause and frames the question for the board. It reports on single companies and across groups, and the Power BI add-on carries the same figures and commentary into Power BI. It is not a forecasting tool; pair it with Fathom, Spotlight Reporting or Syft for the outlook. See the integrations or talk to us.
Sources
Checked on 10 November 2026.
- Intuit QuickBooks UK: view and edit management reports
- Intuit QuickBooks UK: turn on class tracking
- Fathom pricing
- Spotlight Reporting: UK pricing for accountants and AI executive summary, July 2025
- Joiin
Microsoft and Power BI are trademarks of the Microsoft group of companies.
Frequently asked questions
How do I produce a board pack from QuickBooks Online?
Close and lock the month, tag income and costs by class and location, and build one management report with the profit and loss against budget and last year, the balance sheet and the KPIs. Cut every material variance by class until one cause explains most of it, write four sentences per variance, and put the decisions on the first page.
Does QuickBooks Online have management reports?
Yes, on every plan. Simple Start, Essentials and Plus get three templates with financial tables and text boxes. Advanced gets every template, chart widgets, KPI scorecards, an AI-generated executive summary, scheduled delivery and new custom reports.
Which QuickBooks plan do I need for a board pack?
Plus is the minimum for a pack that explains variances, because it adds class tracking. Advanced adds charts, KPI scorecards, the AI summary and scheduled delivery, which save time on the formatting.
What are the best QuickBooks Online add-ons for management reporting?
Fathom, Spotlight Reporting and Syft for reports and forecasts, Joiin for consolidating several files, and Stratavor for the written commentary on each material movement. Judge them on the hours they save each month, not only the price.
Can QuickBooks write board commentary?
QuickBooks Advanced generates an executive summary inside management reports. A summary describes what moved; board commentary names the cause and frames the decision, which depends on class tracking and on cutting each variance to its cause. Stratavor drafts that commentary from figures computed in code.
Does Stratavor work with QuickBooks Online?
Yes. Stratavor connects directly to QuickBooks Online, reads your classes and locations, computes every figure from the ledger and writes the board pack commentary, for single companies and across groups.
The Stratavor digest
One email a month. Worth opening.
Decoded films on real companies' results, short films on how businesses make and lose money, and guides on customers, competitors, risk, cash and the board pack. No sales emails.
By subscribing you agree to receive the monthly Stratavor digest. Unsubscribe at any time from any email. Privacy policy.