How to connect Xero to Power BI for board reporting
On this page
The short answer. There are four ways to get Xero data into Power BI: export reports to Excel and import them, use a third-party connector that pulls from the Xero API on a schedule, build your own integration into a database, or connect to a reporting service that has already modelled the figures. Exports are free but manual. Connectors take an afternoon and a monthly fee. A custom build gives you control but runs into Xero's limits of 60 API calls a minute and 5,000 a day for each organisation, and Xero's developer pricing changed in March 2026. Whichever route you take, the connection is the easy part: the board report needs defined measures, a closed month and commentary. Stratavor connects read-only to Xero, computes every figure in code and, with its Power BI add-on, loads those figures and the commentary into Power BI through Power Query.
Power BI is a common next step when Xero's own reports stop being enough: the board wants trends, several entities side by side, or customer detail that the standard reports do not show. Getting the data across is well trodden. Getting a board report that ties to the ledger every month is where the time goes. This guide sets out the four routes as of November 2026, what each costs, and what to build once the data is in.
The four routes
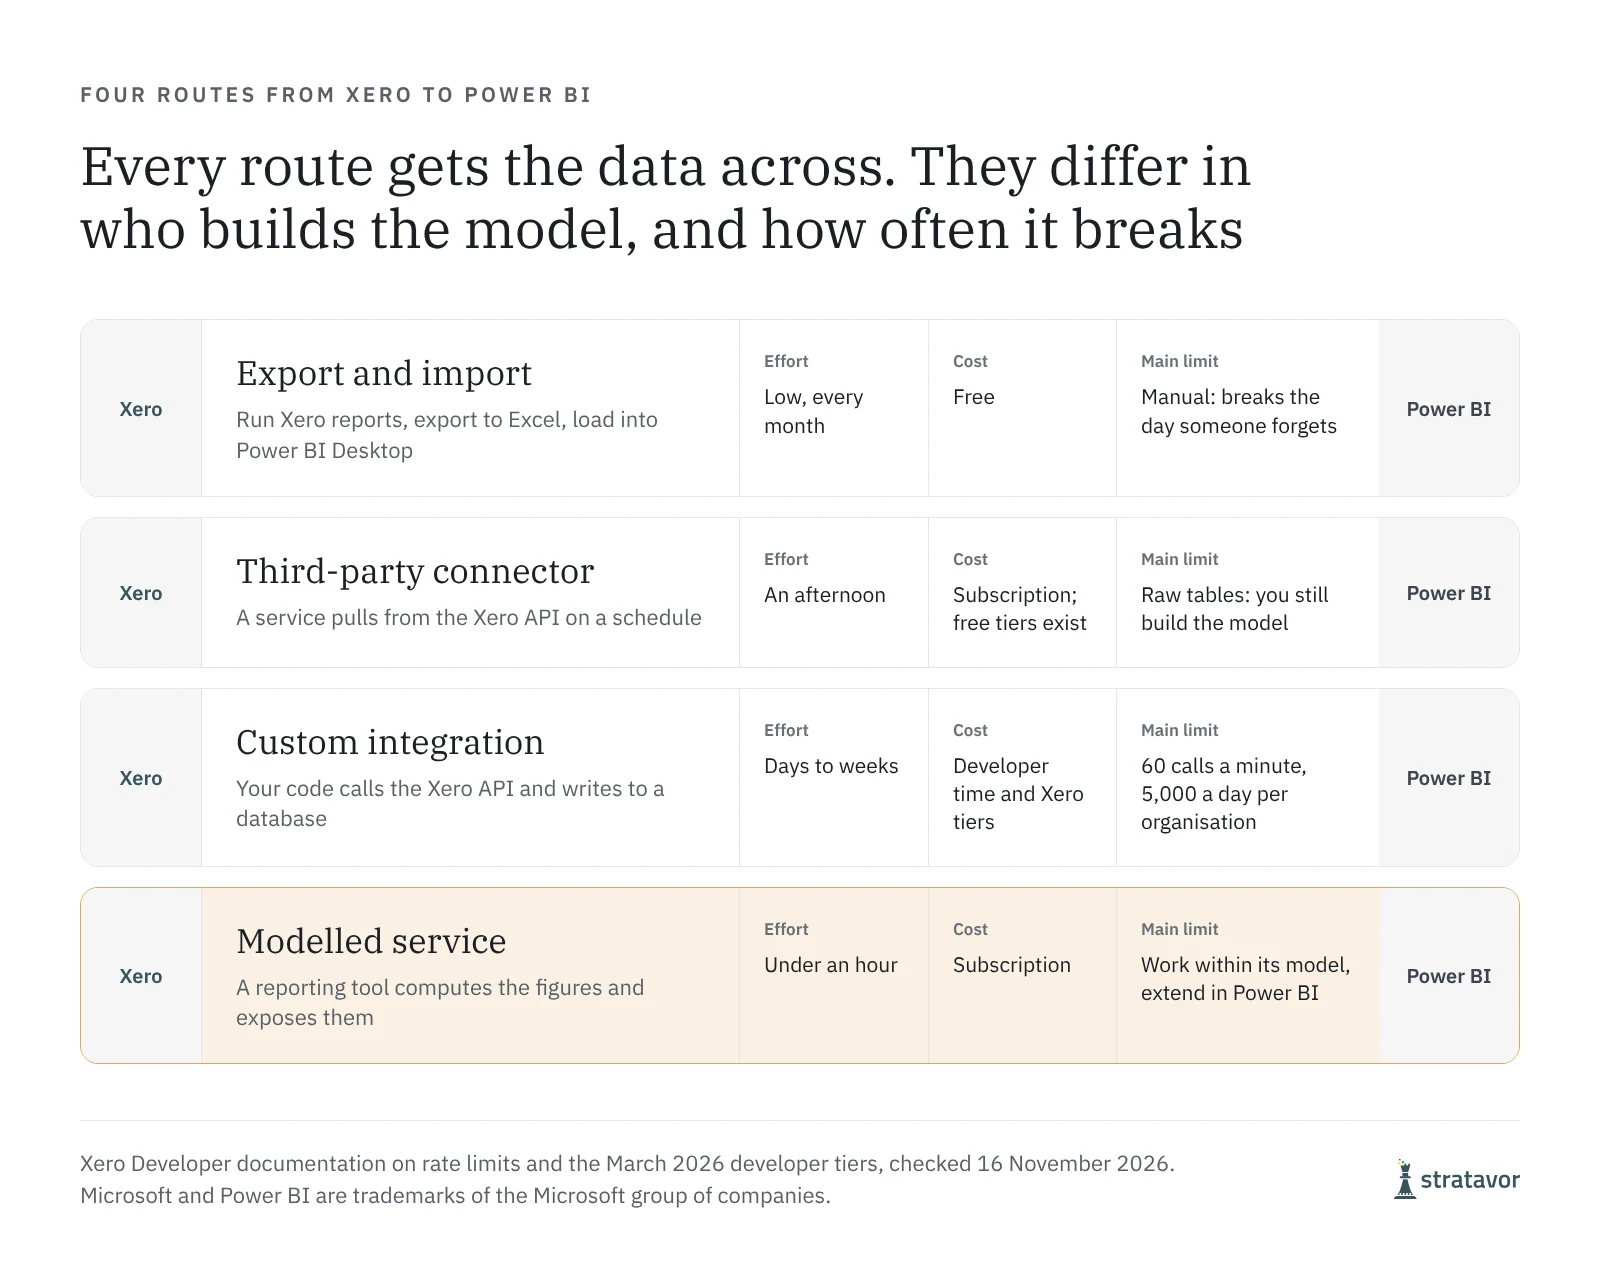
| Route | How it works | Effort | Cost signal | Main limit |
|---|---|---|---|---|
| Export and import | Run Xero reports, export to Excel, load into Power BI Desktop | Low to start, repeated every month | Free | Manual, so it breaks the day someone forgets |
| Third-party connector | A service such as Coupler.io, Windsor.ai or a CData driver pulls from the Xero API on a schedule | An afternoon | Monthly subscription; free tiers exist | Raw tables, so you still build the model and measures |
| Custom integration | Your own code calls the Xero API, writes to a database, Power BI reads the database | Days to weeks | Developer time, hosting, and Xero's developer tiers | Rate limits, maintenance and token handling are yours |
| Modelled reporting service | A reporting tool computes the figures and exposes them to Power BI | Under an hour | Subscription | You work within the service's model, extended in Power BI |
Older guides describe a free Xero app inside Power BI that loaded a ready-made dashboard. Do not plan around it: treat any built-in route as something to test on the day, and choose one of the four above.
Xero's limits shape every route
Xero's developer documentation sets the same limits for every app: five calls in progress at once, 60 calls a minute and 5,000 calls a day for each connected organisation, with an app-wide ceiling of 10,000 calls a minute. A refresh that pulls every invoice line for a busy organisation can hit the daily limit, so good connectors pull changes since the last refresh rather than everything.
From 2 March 2026, Xero moved developers onto tiers. Starter is free for up to five connections; Core is AUD 35 a month for up to 50 connections with 10 GB of data out; Plus is AUD 245 a month for up to 1,000. Xero's FAQ says bespoke integrations that accountants and bookkeepers build for their own practice or a single client are exempt, and that Custom Connections stay on their existing terms. If you are building your own, check which applies to you with Xero before you start.
What to build once the data is in
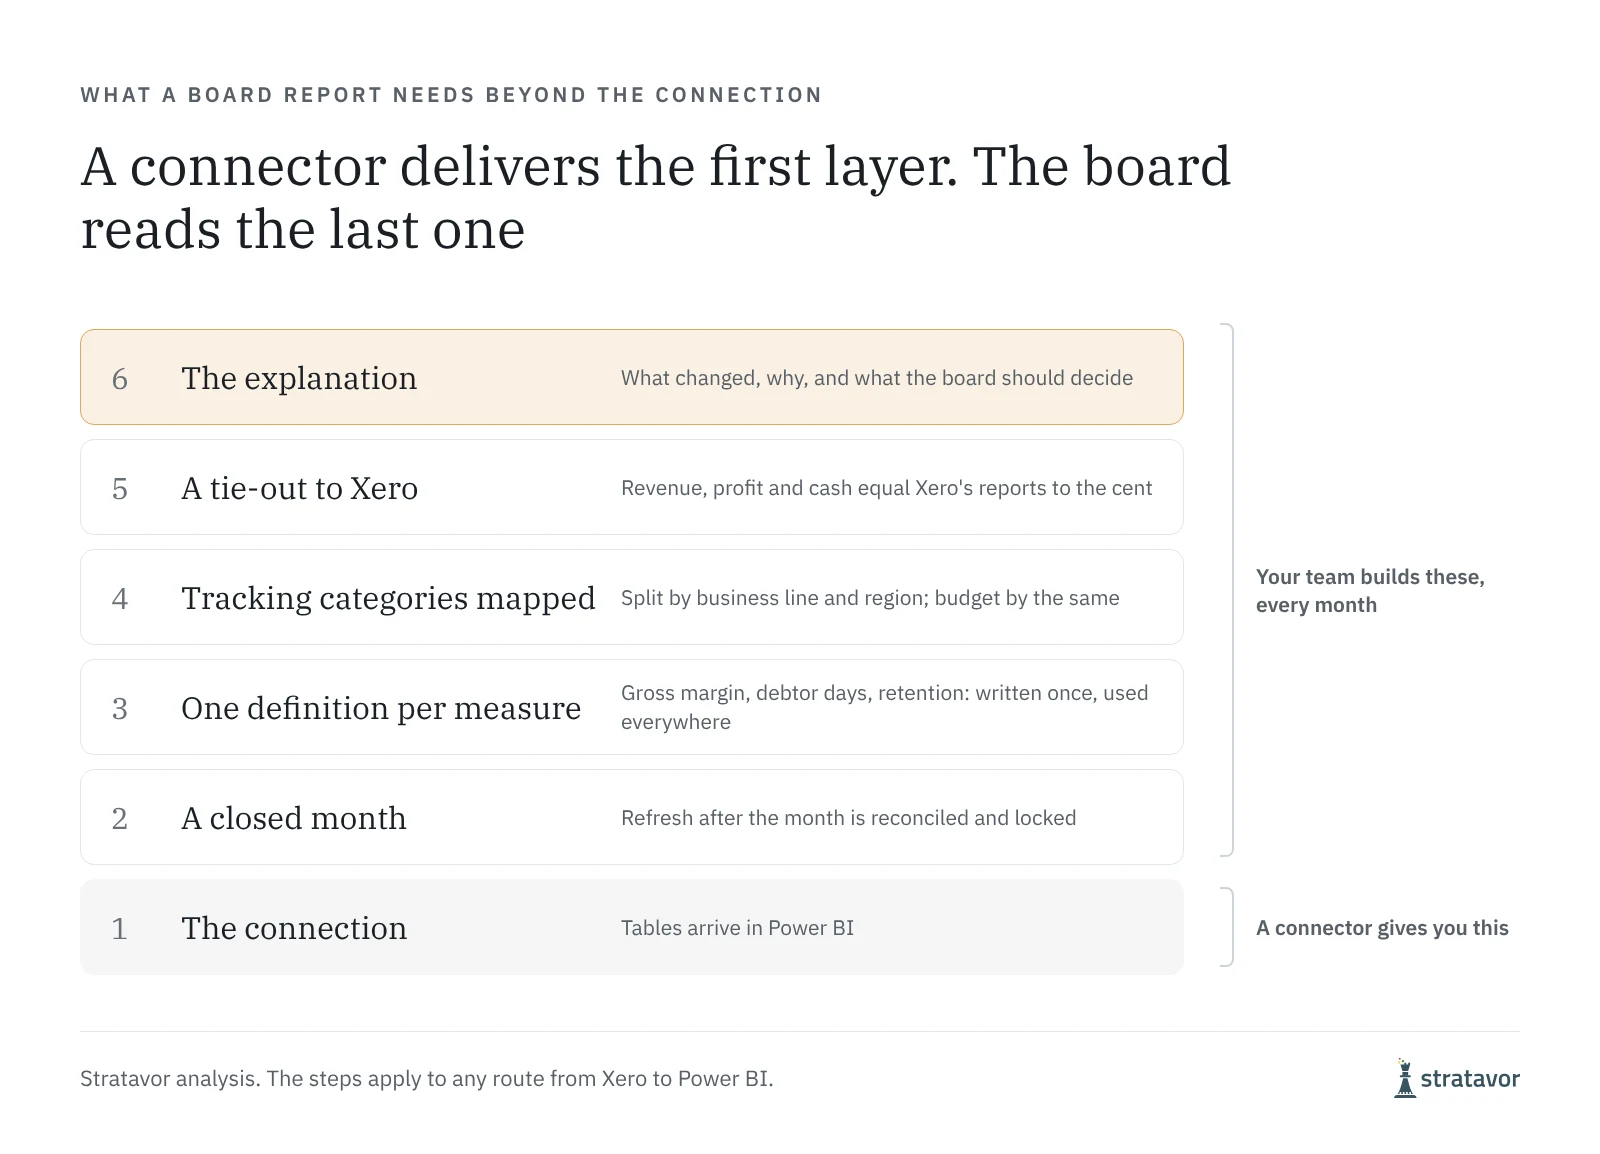
A connection gives you tables. A board report needs five more things:
- A closed month. Refresh after the month is reconciled and locked, and stamp each report with the period and the refresh date, so nobody presents a half-closed month.
- One definition per measure. Gross margin, debtor days and recurring revenue each need a written definition, used in every visual. Two versions of the same number in one pack end the meeting.
- Tracking categories mapped. Xero's tracking categories are how you split by business line or region. Map them once in the model, and budget by the same categories.
- A tie-out. Revenue, profit and cash in Power BI should equal Xero's profit and loss and balance sheet to the cent. Build a check page and look at it before every board meeting.
- The explanation. A chart shows that margin fell. The board needs to know why, by how much, and what to decide. That is the commentary, and no connector writes it.
Our guide to the board pack from Xero sets out the pages a monthly pack needs, and our board commentary template covers the writing.
Which route suits which business
- One company, a monthly pack, a spreadsheet-confident team: export and import is fine to start. Move on when the monthly rebuild takes more than an hour.
- Several entities, or a board that wants weekly figures: a third-party connector, with a model you own.
- An in-house data team that already runs a warehouse: a custom integration, written to stay inside the limits.
- A finance team that wants board figures it can trust without building the model: a modelled service, extended in Power BI where the board asks for more.
Where Stratavor fits
Stratavor connects read-only to Xero, as well as QuickBooks Online, Sage, NetSuite and Deltek Vantagepoint, with HubSpot for customer and pipeline context. It computes every figure from the ledger in code, writes the commentary on each material movement, and reports on single companies and across groups. The Power BI add-on loads those same figures and the commentary into Power BI through Power Query: governed views, measures that cite their definitions, and a four-page starter report you can change. Nothing in Power BI can write back to your books. See the Power BI add-on or book a demo.
Sources
Checked on 16 November 2026.
- Xero Developer: API rate limits
- Xero Developer: pricing and policy updates
- Coupler.io: Xero to Power BI
- Windsor.ai: connect Xero to Power BI
Microsoft and Power BI are trademarks of the Microsoft group of companies.
Frequently asked questions
How do I connect Xero to Power BI?
Export Xero reports and import them into Power BI Desktop, use a third-party connector that pulls from the Xero API on a schedule, build your own integration into a database, or connect to a reporting service that already models the figures. For a board report, choose the route that refreshes after the month is closed and ties to Xero's profit and loss.
Does Power BI have a native Xero connector?
Older guides describe a free Xero app in Power BI with a ready-made dashboard. Test what is available on the day rather than relying on it; most teams use a third-party connector, their own integration or a reporting service.
What are the Xero API limits?
Five calls in progress at once, 60 calls a minute and 5,000 calls a day for each connected organisation, with an app-wide limit of 10,000 calls a minute. Exceeding a limit returns an error telling the app how long to wait.
Does it cost anything to use the Xero API?
Since 2 March 2026 developers are on tiers: Starter is free for up to five connections, Core is AUD 35 a month for up to 50, and Plus is AUD 245 a month for up to 1,000. Bespoke integrations accountants build for their own practice or a single client are exempt. Check with Xero which terms apply to you.
Can Power BI write board commentary from Xero data?
Power BI shows what moved. Commentary that names the cause and frames the board's decision has to come from someone cutting each variance to its cause, or from a tool built for it. Stratavor writes that commentary from figures computed in code and carries it into Power BI with the add-on.
Is the Stratavor Power BI connection read-only?
Yes. It connects through Power Query with a read-only login for your organisation, every connection is encrypted, and only your organisation's data is returned.
The Stratavor digest
One email a month. Worth opening.
Decoded films on real companies' results, short films on how businesses make and lose money, and guides on customers, competitors, risk, cash and the board pack. No sales emails.
By subscribing you agree to receive the monthly Stratavor digest. Unsubscribe at any time from any email. Privacy policy.