Xero board reporting: how to produce a board pack from Xero
On this page
The short answer. Xero produces the numbers for a board pack: the profit and loss, the balance sheet, budget against actual and cuts by tracking category, with dashboards, health scorecards and a longer cash flow forecast on the higher plans. Budgets come with the Comprehensive and Ultimate plans, and since November 2026 Xero can hold a budget for each tracking category, which is what lets a variance be explained rather than described. What Xero leaves to people is the cause of each movement and what it means for the board. Lock the month, report by the tracking categories you budget by, cut every material variance until one cause explains most of it, and write four sentences per variance: what happened, why, what it changes and what to do.
Xero keeps the books for many growing businesses in the UK and Ireland, and its reporting has moved on: analytics built on Syft arrived in January 2026, and new budgets in November 2026. What it still cannot do on its own is tell the board why the month went the way it did. This guide covers what each plan gives you, a monthly routine for the pack, how to find the cause of a variance with tracking categories, the apps that sit on Xero, and how to write the part the board reads first.
What Xero gives you, plan by plan
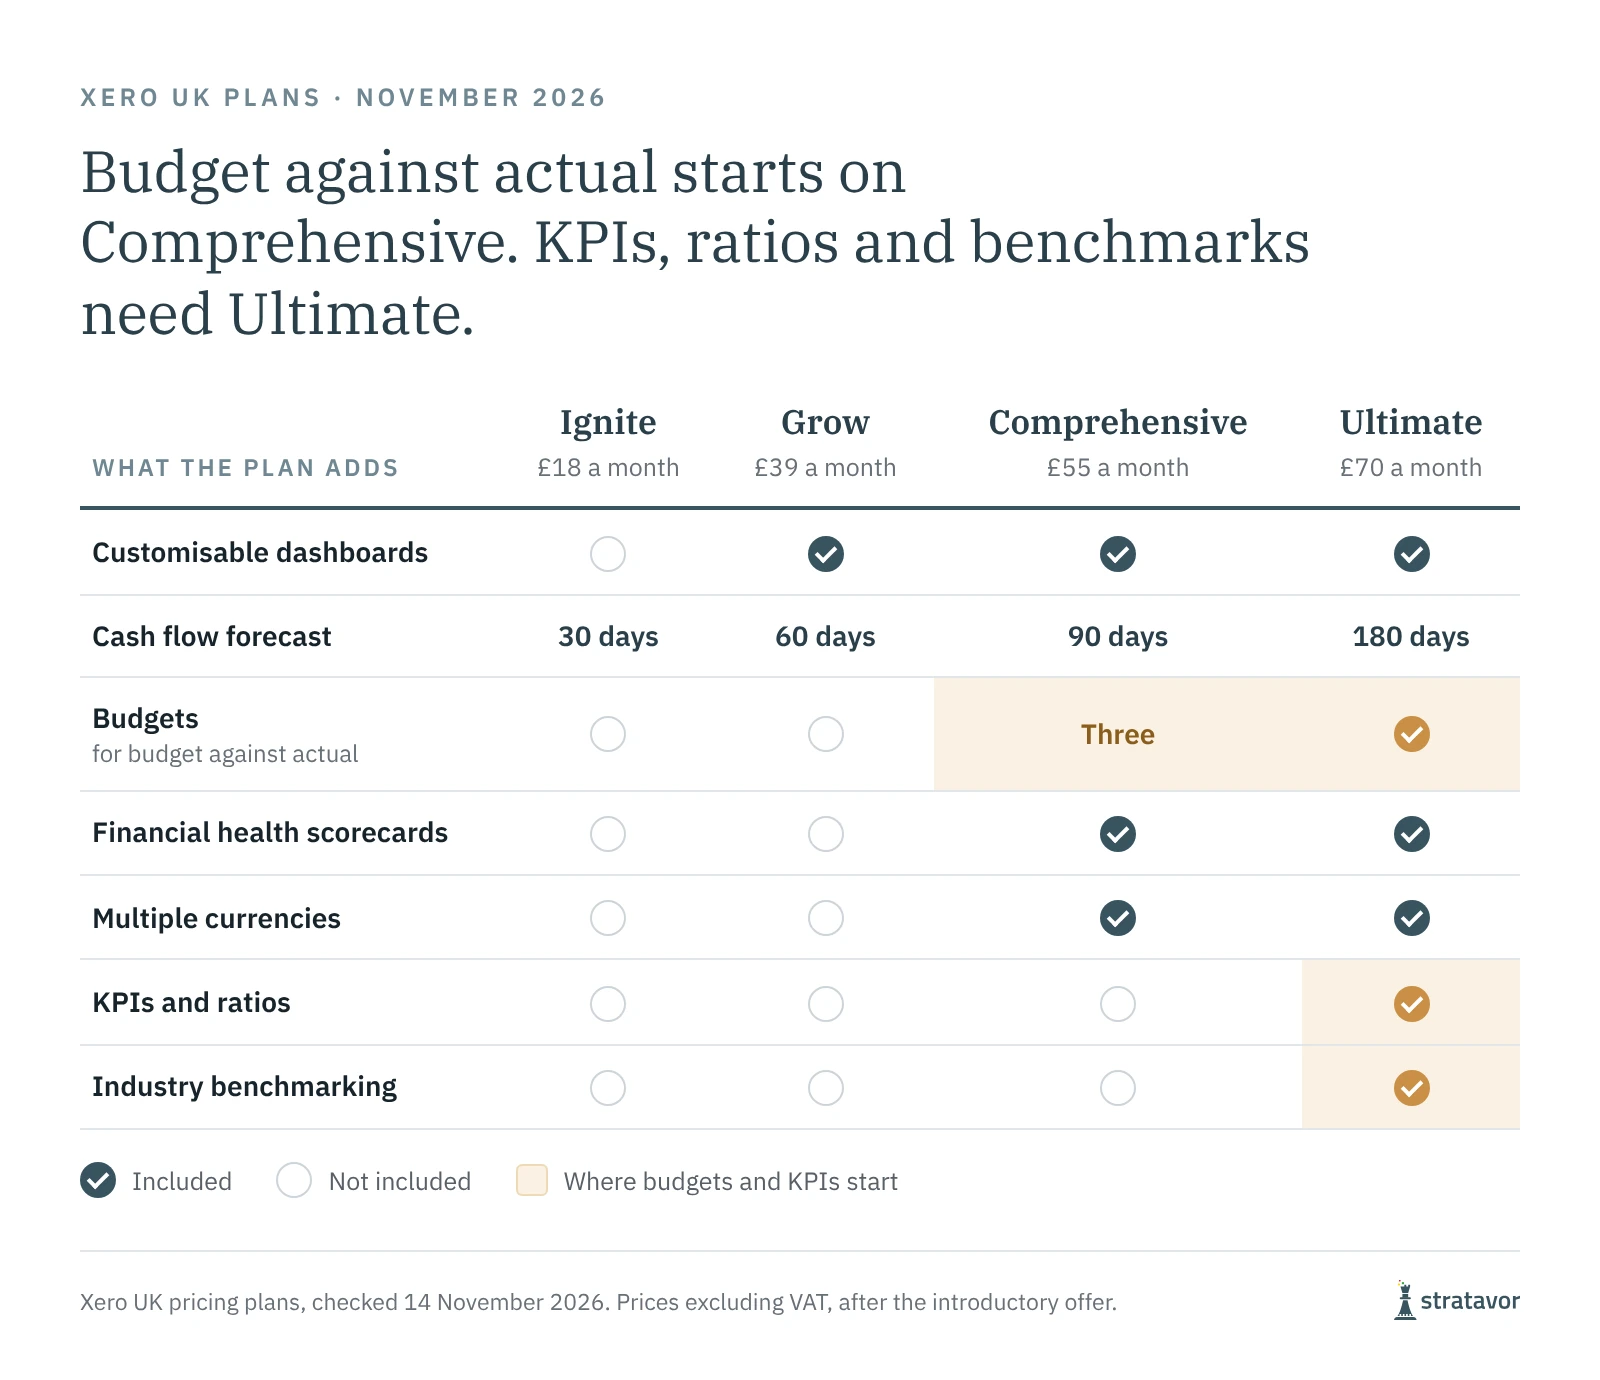
Xero has sold four plans in the UK since September 2024: Ignite, Grow, Comprehensive and Ultimate, at £18, £39, £55 and £70 a month excluding VAT once the introductory offer ends. For a board pack the dividing line is budgets. Xero's pricing table lists none on Ignite or Grow, three on Comprehensive and budgets included on Ultimate, and a pack without a budget can only compare the month with the past. Comprehensive also adds financial health scorecards, multiple currencies and analytics powered by Syft. Ultimate adds KPIs and ratios and industry benchmarking. The cash flow forecast runs from 30 days on Ignite to 180 days on Ultimate.
Two releases matter for board reporting. In January 2026 Xero launched analytics built on Syft, the reporting company it agreed to buy in October 2024: customisable dashboards, a cash flow manager that projects up to 180 days with what-if scenarios, AI-generated summaries and business health scorecards. In November 2026 it released new budgets: a budget can now be built for each tracking category, starting from zeros, last month's actuals or the last 12 months of actuals, adjusted by an amount or a percentage, and added to other Xero reports to compare actuals with budget.
What Xero does not do is write commentary on each variance or consolidate several organisations into one set of group accounts. Those are the two jobs the apps on top of Xero exist for.
A monthly routine for the pack
- Close and lock the month. Reconcile the bank, clear the suspense account and set a lock date, so nothing posted later changes the figures in the pack.
- Tag by tracking category. Agree the categories that explain the business (department, branch, service line or region) before the first pack, and tag every invoice and bill. Without them, no report can tell you what caused a variance.
- Budget by the same categories. Xero's new budgets can be built for each tracking category, from the last 12 months of actuals. A budget held only for the whole company cannot explain a departmental variance.
- Run one fixed set of reports. The profit and loss against budget and last year, the balance sheet and the KPIs, in the same layout every month, so directors know where to look.
- Set a materiality threshold. Comment on every variance above a set amount or percentage, and say nothing about the rest.
- Cut every material variance by tracking category. Department, then region, then customer or supplier, until one cause explains most of it. Then write four sentences: what happened, why, what it changes and what to do. Our board commentary template sets out the standard.
- Put the decisions on page one. The summary and the decisions the board is asked to make come before any statement.
Find the cause with tracking categories
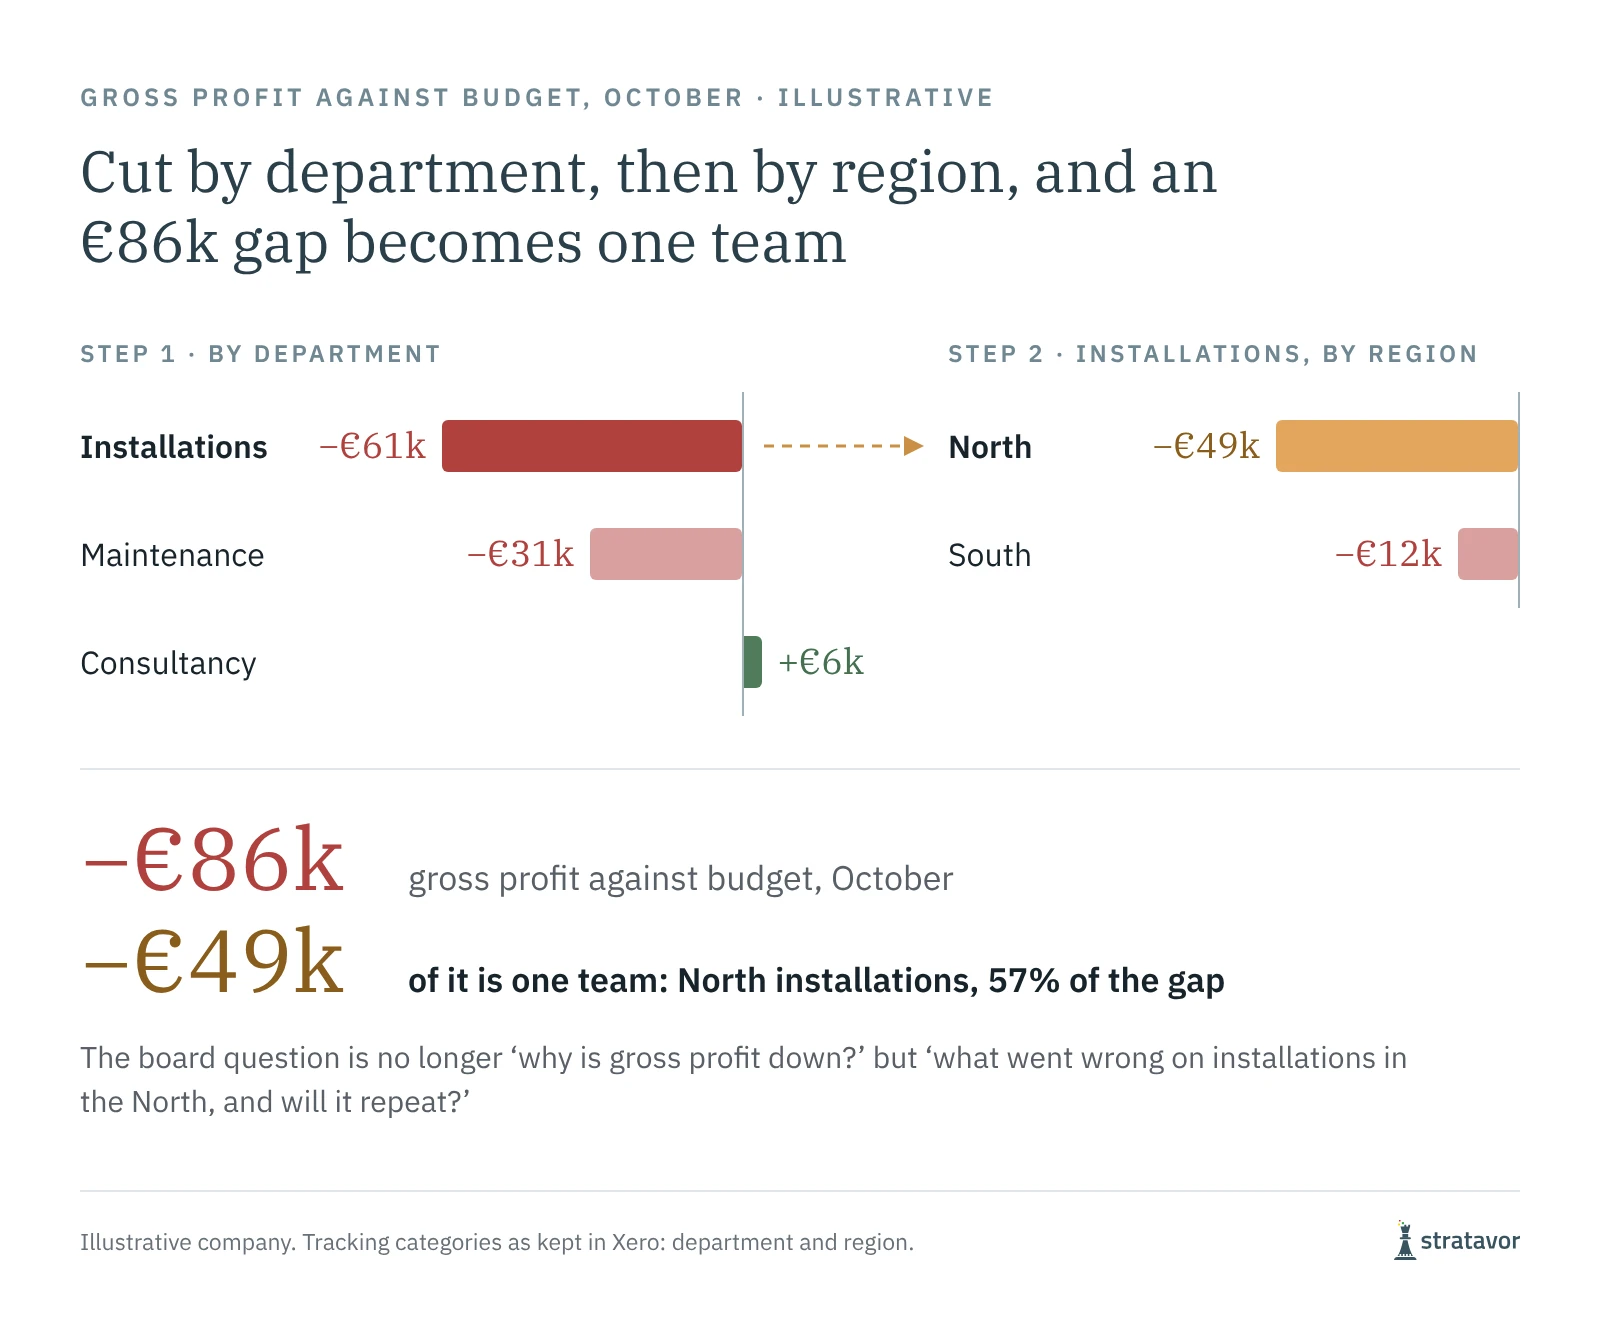
Tracking categories are where a Xero board pack earns its keep. In the illustrative company, October gross profit is €86,000 below budget. Cut by department, two teams are behind and one is ahead, and Installations accounts for €61,000. Cut Installations by region and the North accounts for €49,000 on its own, 57% of the whole gap. The question for the board changes from why gross profit is down to what went wrong on installations in the North, and whether it will repeat.
The cut itself takes minutes in Xero's profit and loss, filtered by one tracking category and then the other. What takes the time is doing it for every material variance, every month, and then writing up what it found. That is the step most packs skip, which is why so much commentary reads like this: gross profit was below budget due to lower margins on installations. It describes the movement. It does not explain it.
A summary is not commentary
Xero's analytics include AI-generated summaries, and they save time on a first read of the month. A summary describes what moved: revenue was 4% below budget and gross margin slipped two points. Board commentary explains it: which category or customer caused the gap, whether it is timing that reverses next month or a change that will not, what it means for the forecast, and what the board should decide. Test any summary on your own largest variance. If it does not name the cause and its size, someone still has to write the paragraph.
Apps that sit on Xero for board reporting
| Tool | What it adds to Xero reporting | Price signal, November 2026 |
|---|---|---|
| Xero reports, budgets and analytics | Statements, budget against actual by tracking category, dashboards, health scorecards and a cash flow forecast, with AI summaries in analytics | Part of the plan: £18 to £70 a month in the UK |
| Fathom | Management reports, KPIs, three-way forecasts, consolidation and Commentary Writer | Pro US$450 a month for 25 companies |
| Spotlight Reporting | Reporting, forecasting and dashboards, consolidation across entities and currencies, and an AI executive summary | UK adviser plans from £295 a month for up to 10 organisations |
| Syft | Reports, consolidation, budgets and forecasts; Xero agreed to buy it in October 2024 and keeps it as a standalone product | See vendor |
| Joiin | Consolidation across Xero organisations, with eliminations and multiple reporting currencies | Priced by the number of companies consolidated, from US$28 a month |
| Stratavor | Commentary on each material movement that names the cause and frames the board's question, from figures computed in code | From €499 a month |
A reporting app suits a business that wants richer formatting and a three-way forecast. Joiin suits a group with several Xero organisations to consolidate. If the numbers are ready by day two and the commentary is still being written on day five, the gap is the analysis. Our comparison of the best Xero reporting tools for board packs covers ten apps in depth, and everything Xero's standard reports can't show you sets out the gaps they fill.
Groups of Xero companies
Xero does not consolidate several organisations natively, so a group needs an app such as Joiin, Fathom, Spotlight Reporting or Syft for the consolidated statements. Report the group first and each company second, in the same layout, and comment on the companies that moved the group rather than on every entity. Check that intercompany balances eliminate before the pack goes out: a group figure that does not reconcile to the companies behind it loses the board's trust faster than any variance. Our guide to board packs for many clients covers the same discipline for advisers who report on several businesses.
Where Stratavor fits
Stratavor connects read-only to Xero, as well as QuickBooks Online, Sage, NetSuite and Deltek Vantagepoint, with HubSpot for customer and pipeline context. It reads the tracking categories you already keep, computes every figure from the ledger in code, and writes commentary on each material movement that names its cause and frames the question for the board. It reports on single companies and across groups, and the Power BI and Excel add-on carries the same figures and commentary into Power BI. It is not a forecasting tool; pair it with Fathom, Spotlight Reporting or Syft for the outlook. See the integrations or talk to us.
Sources
Checked on 14 November 2026, except the analytics release and the Syft questions and answers, checked on 7 November 2026.
- Xero UK: pricing plans, with the Grow, Comprehensive and Ultimate plan pages
- Xero UK: analytics
- Xero: analytics launch, January 2026
- Xero blog: new budgets, November 2026
- Xero: questions and answers on Syft
- Fathom pricing
- Spotlight Reporting: UK pricing for accountants and consolidated reporting
- Joiin pricing
Microsoft and Power BI are trademarks of the Microsoft group of companies.
Frequently asked questions
How do I produce a board pack from Xero?
Close and lock the month, tag income and costs by tracking category, and budget by the same categories. Run one fixed set of reports with the profit and loss against budget and last year, the balance sheet and the KPIs. Cut every material variance by tracking category until one cause explains most of it, write four sentences per variance, and put the decisions on the first page.
Can Xero produce a board pack on its own?
Not in the form a board expects. Xero produces the statements, budget against actual and cuts by tracking category, and its analytics add dashboards, health scorecards, a cash flow forecast and AI summaries. It does not write commentary on each variance or consolidate a group of organisations.
Which Xero plan do I need for board reporting?
Comprehensive is the minimum for a pack that compares the month with a budget, because budgets start there: Xero's UK pricing table lists three. Ultimate adds KPIs and ratios, industry benchmarking and the longest cash flow forecast, at 180 days.
Can I budget by tracking category in Xero?
Yes. Xero's new budgets, released in November 2026, let you create a budget for each tracking category, starting from zeros, last month's actuals or the last 12 months of actuals, and compare actuals with budget in other Xero reports. Budgets come with the Comprehensive and Ultimate plans.
What are the best Xero add-ons for board reporting?
It depends on the job. Fathom, Spotlight Reporting and Syft for formatted reports and forecasts, Joiin for consolidating several Xero organisations, and Stratavor for the written commentary on each material movement. Many businesses use one tool for the numbers and another for the analysis.
Can Xero write board commentary?
Xero's analytics include AI-generated summaries. A summary describes what moved; board commentary names the cause and its size, says what it changes and frames the decision, which depends on tracking categories and on cutting each variance to its cause. Stratavor writes that commentary from figures computed in code.
Does Stratavor work with Xero?
Yes. Stratavor connects read-only to Xero, reads your tracking categories, computes every figure from the ledger and writes the board pack commentary, for single companies and across groups.
The Stratavor digest
One email a month. Worth opening.
Decoded films on real companies' results, short films on how businesses make and lose money, and guides on customers, competitors, risk, cash and the board pack. No sales emails.
By subscribing you agree to receive the monthly Stratavor digest. Unsubscribe at any time from any email. Privacy policy.