Which customers are about to leave? Five signals in your invoice data
On this page
The short answer. Most business customers do not announce that they are leaving. They order less often, spend less, buy a narrower range and take longer to pay, and only then stop. All of that shows in the invoice ledger months before it shows in total revenue. Each month, compare every customer with its own history on five signals: how often it orders, how much it spends, how much of your range it buys, how long it takes to pay and how many credits it needs. Flag the customers that have moved on two or more, rank them by the revenue at stake, and give each one an owner and a date for a conversation. Stratavor reads the invoice ledger read-only and names the customers behind each material movement in the monthly commentary, so the conversation starts with the right names.
Total revenue can hold steady while a business loses customers. New customers and price rises fill the gap, and the leadership team sees a flat line. It matters more than it looks. In the Harvard Business Review in September 1990, Frederick Reichheld of Bain and Earl Sasser of Harvard Business School reported that companies could boost profits by almost 100% by retaining just 5% more of their customers. For most businesses, the cheapest growth available is the revenue they are about to lose without noticing.
This guide is for businesses without subscriptions: distributors, manufacturers, agencies, professional firms and anyone else whose customers simply stop placing orders. It sets out the five signals, how to measure retention from invoices, and a monthly routine that turns the ledger into a list of calls to make.
Why stable revenue hides churn
A revenue line shows the net of four movements: customers lost, customers spending less, customers spending more and customers who are new. Only the total reaches most monthly reports, so the losses are hidden by the gains.
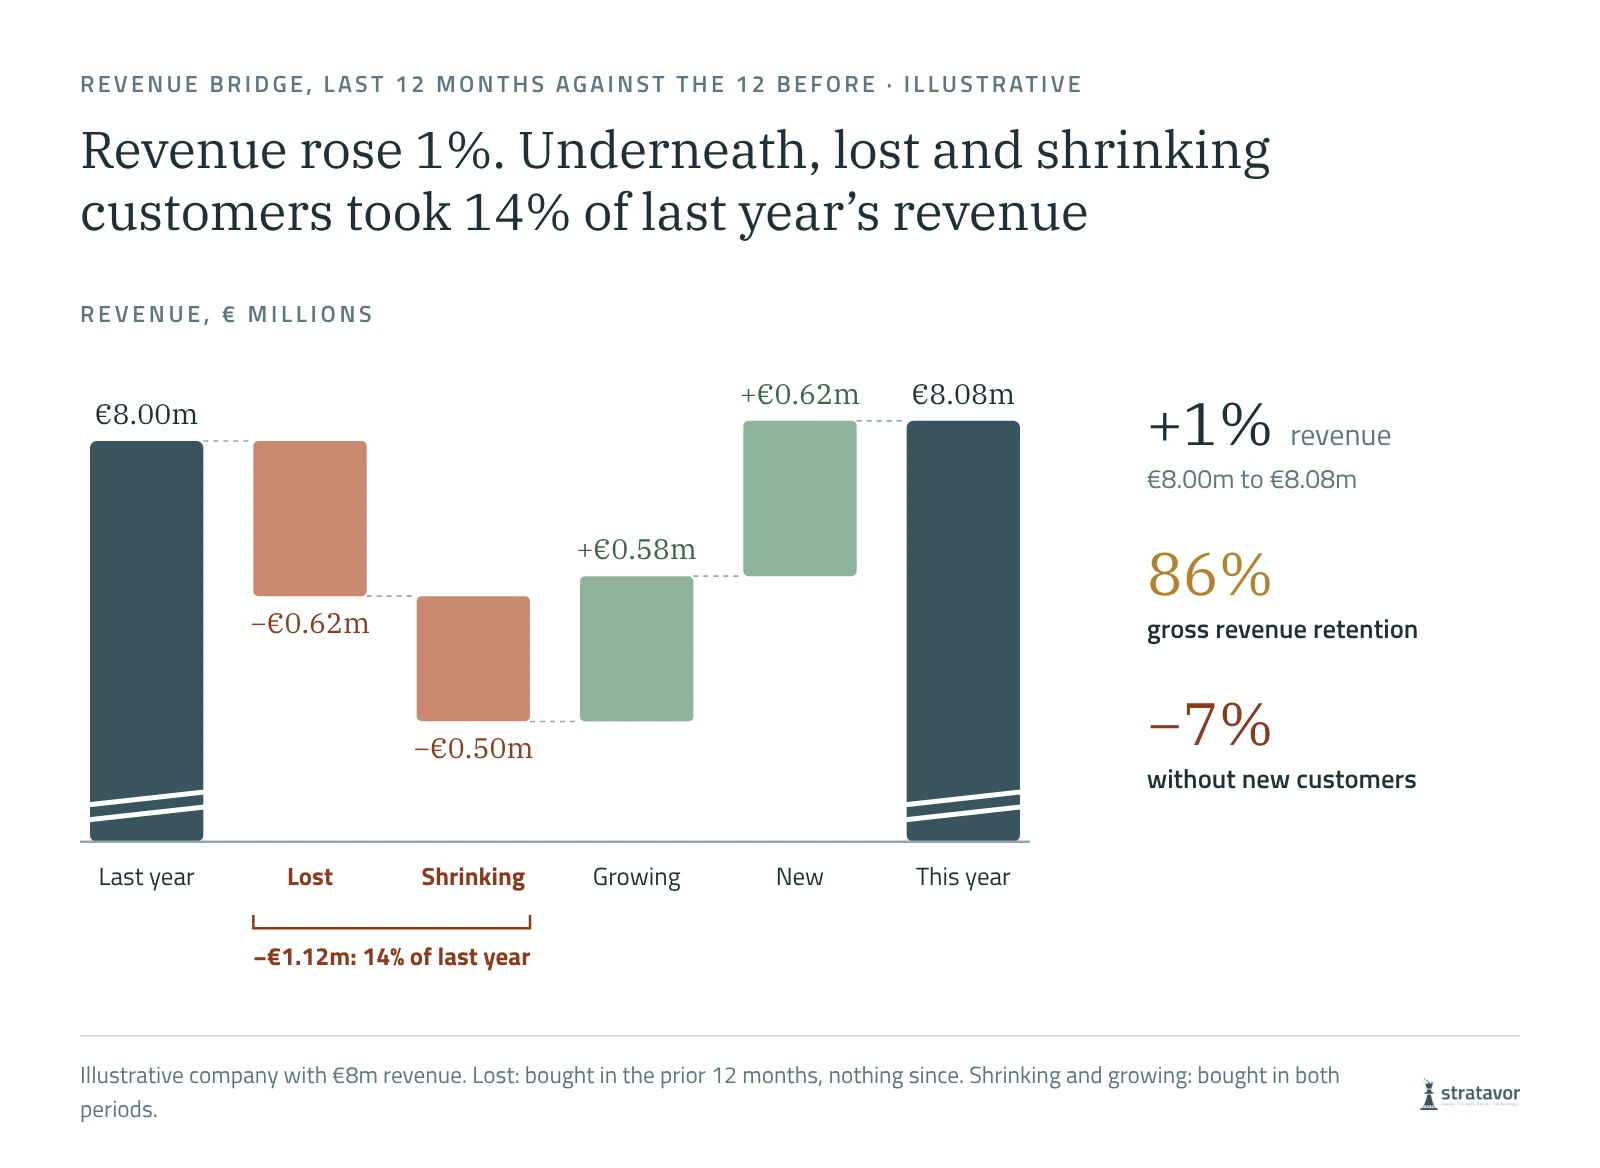
In the example, revenue rose 1%. Underneath, customers who stopped buying took €0.62m and customers who bought less took another €0.50m: together 14% of last year's revenue. New customers covered the gap this year. If winning new customers slows next year, the same losses will show as a fall in revenue, and by then most of the customers concerned will have settled with someone else.
Five signals in the invoice ledger
Each signal compares a customer with its own history, not with the market or with other customers. A customer that has always paid in 50 days is not a risk at 50 days; a customer that has always paid in 30 days is worth a call at 45.
| Signal | What to measure | Flag when |
|---|---|---|
| Order frequency | Days between invoices, against the customer's usual gap over the last year | The latest gap is half as long again as usual |
| Spend | Revenue in the last three months, against the same three months a year earlier | Down by a fifth or more |
| Range | Product lines or services bought in the last three months, against the year before | Down by one line or more |
| Days to pay | Days from invoice to payment, against the customer's own average | Ten days or more above usual |
| Credits | Credit notes and disputed invoices as a share of the customer's invoiced value | Above 5% |
Comparing the same three months a year earlier keeps seasonality out of the spend signal. The range signal is often the most telling: a customer that still buys your core line but has stopped buying the rest is usually buying those things from a competitor, and the competitor now has a relationship to build on.
Days to pay needs care. Late payment is common: in Atradius's Payment Practices Barometer for Western Europe, published in May 2026, nearly four in five companies reported late payments from business customers. A customer paying later than its own habit can mean strain in its own business or that you have slipped down its list. Either way, it is worth knowing which.
No single signal is enough. Order timing is noisy, and one quiet month proves nothing. Two signals moving together is the point to look.
One customer, slipping
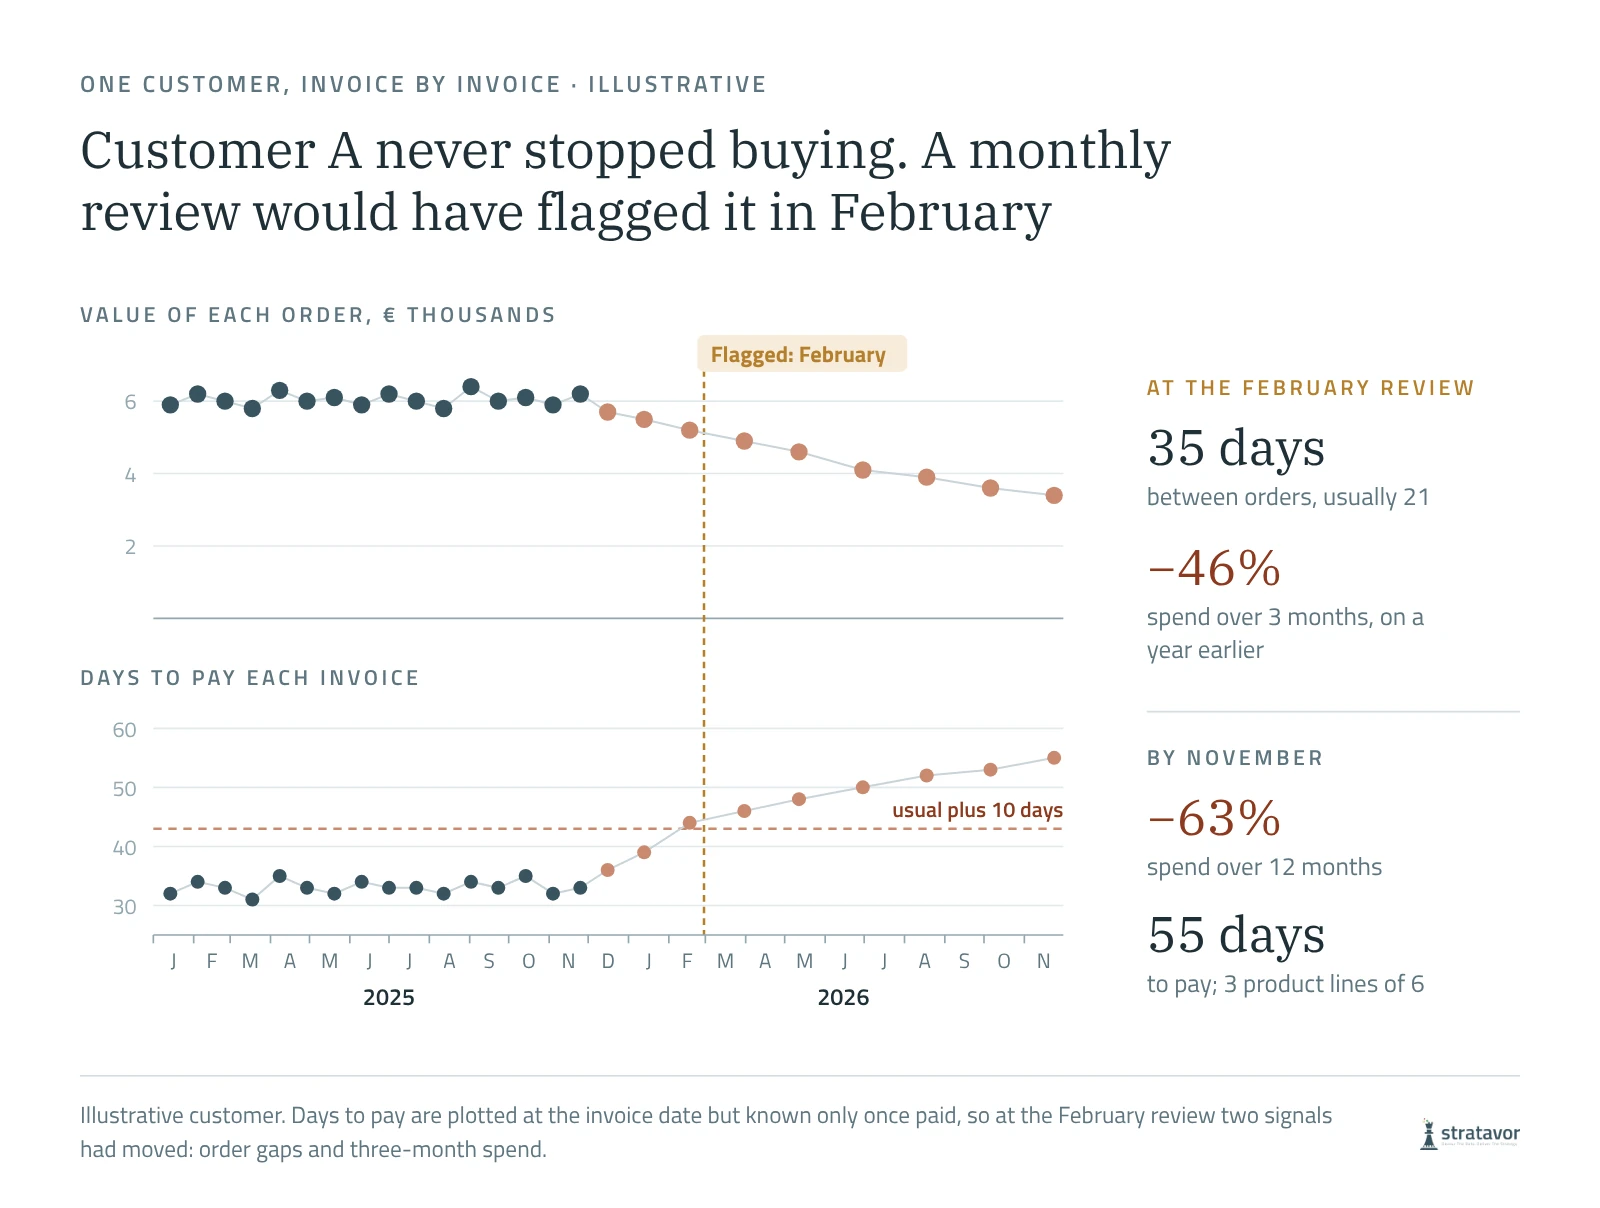
Customer A never stopped buying, which is why it did not stand out. Through 2025 it ordered every three weeks. From December, the gaps stretched, each order was a little smaller, and it dropped first one product line and then two more. At the end of February two signals had moved together, and a monthly review would have flagged it. By November, its spend over the last 12 months was down 63%.
The flag does not say why. Customer A might have lost a contract of its own, been offered a better price elsewhere or had a problem with a delivery that nobody passed on. A call in February finds out which, while there is still something to save.
Measure retention by revenue, not by count
Counting customers treats a €2,000 customer and a €200,000 customer the same. Two measures based on revenue do better, and both can be calculated from invoices alone:
- Gross revenue retention is this year's revenue from last year's customers, counting each customer at no more than it spent last year, divided by last year's revenue. Growth from other customers cannot offset a loss. In the example, it is 86%.
- Net revenue retention is the same calculation without the cap, so growth from existing customers counts. In the example, it is 93%.
For businesses without subscriptions, compare the last 12 months with the 12 before, customer by customer. The trend matters more than any benchmark: a fall of two or three points in gross retention over a year is a question for the board, whatever the total revenue line says.
Build the at-risk list in an afternoon
- Export the invoices. Two years of invoice lines with customer, date, value, product line, due date and date paid, from Xero, QuickBooks Online, Sage, NetSuite or Deltek Vantagepoint.
- Calculate the five signals for each customer. Use the last three months against the same months a year earlier, and each customer's own averages for gaps and days to pay.
- Flag the customers that have moved on two or more. Leave out customers too small to matter, for example those under 1% of revenue.
- Rank by revenue at stake. Use each flagged customer's revenue, or better its gross margin, over the last 12 months.
- Give each one an owner and a date. Usually the person who holds the relationship, with a conversation booked within two weeks. Record what you learn against the customer in your CRM, such as HubSpot, so the reasons build up over time.
The first run takes an afternoon in a spreadsheet. After that, the list is a monthly refresh that sits alongside the management accounts.
What to do with the list
The list is for decisions, not for filing. For each flagged customer, the leadership team needs one of four answers within a month:
- A service problem we can fix. Fix it, and tell the customer what changed.
- A price or terms problem. Decide whether keeping the customer is worth the margin, using the revenue at stake.
- A competitor in the account. Find out what they offered and which lines they took, and decide whether to compete for the rest.
- A change in the customer's own business. Adjust the plan and the forecast, and stop chasing what will not come back.
If a top five customer appears on the list, it goes to the board, with the revenue and margin at stake and the plan.
Where software helps
Accounting systems report sales by customer and aged debtors well. What they rarely do is compare each customer with its own history and say who has changed. Stratavor connects read-only to Xero, QuickBooks Online, Sage, NetSuite or Deltek Vantagepoint, with HubSpot for pipeline and contact context, computes every figure in code from the ledger, and names the customers behind each material movement in the monthly commentary, so the conversation starts with the right names. The Power BI add-on carries the same figures and commentary into Power BI. For the wider monthly pack, see management accounts with commentary.
Sources
Checked on 11 November 2026.
- Frederick Reichheld and W. Earl Sasser Jr., Zero Defections: Quality Comes to Services, Harvard Business Review, September 1990, via Bain & Company
- Atradius: Nearly four in five companies in Western Europe faced with late payments, 20 May 2026
Microsoft and Power BI are trademarks of the Microsoft group of companies.
Frequently asked questions
How do I know which customers are about to leave?
Compare each customer with its own history on five signals: order frequency, spend, the range of products it buys, days to pay and credits. Customers that have moved on two or more at once are the ones to call. The signals show in the invoice ledger months before the loss shows in total revenue.
What are the early warning signs that a B2B customer is about to leave?
Longer gaps between orders, smaller orders, buying fewer of your product lines, paying later than usual and more credit notes or disputes. Buying a narrower range is often the clearest sign that a competitor has won part of the account.
How do I measure customer retention without subscriptions?
Use revenue, not customer counts. Gross revenue retention is this year's revenue from last year's customers, capped at what each spent last year, divided by last year's revenue. Net revenue retention is the same without the cap. Compare the last 12 months with the 12 before, customer by customer.
What is a good gross revenue retention rate?
There is no reliable benchmark outside subscription software, because ordering patterns differ so much between sectors. Track your own trend and compare segments, such as product lines or regions. A fall of two or three points in a year deserves a place in the board pack.
Can I do this in Xero or QuickBooks?
Yes, with an export. Both produce sales by customer and aged receivables reports. Export invoice-level data for two years, calculate the five signals for each customer in a spreadsheet, and refresh it each month with the management accounts.
How often should we review at-risk customers?
Monthly, with the management accounts, for the whole customer base. For the customers that make up most of your revenue, a quick weekly look at orders and payments is worth the time.
The Stratavor digest
One email a month. Worth opening.
Decoded films on real companies' results, short films on how businesses make and lose money, and guides on customers, competitors, risk, cash and the board pack. No sales emails.
By subscribing you agree to receive the monthly Stratavor digest. Unsubscribe at any time from any email. Privacy policy.